
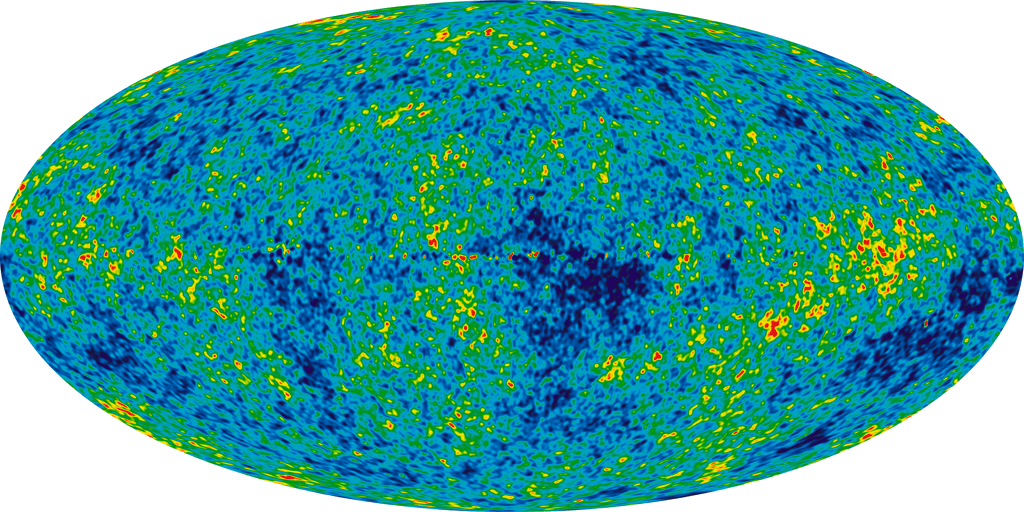
This image is a weighted linear combination of data in five radio frequency bands (23, 33, 41, 61 and 94 GHz) which minimizes the foreground contamination from the Milky Way. It is a snapshot of the photosphere or last scattering surface: our view of the universe when it first became transparent to electromagnetic radiation. The color scale in this image corresponds to temperatures of from 2.7248 to 2.7252 K (blue to red). This represents a deviation from perfect isotropy of one part in 13625.
Note that the last scattering surface depends on both the time of decoupling and the place and time of observation. The expansion of the universe changes the distance to the last scattering surface, and the passage of time increases our horizon, so we see more of the universe at decoupling as time passes.The minute deviations from perfect isotropy in the CMBR tells us that there were small inhomogeneities in the plasma:
These oscillations occurred at different length scales and left their imprint on the CMBR we observe today. Of course, those imprints have been modified by the expanding universe, and by other factors we have yet to discuss.
By comparing the CMBR temperatures at different angles, we can construct the power spectrum: a measure of the correlations between temperature as a function of angle.
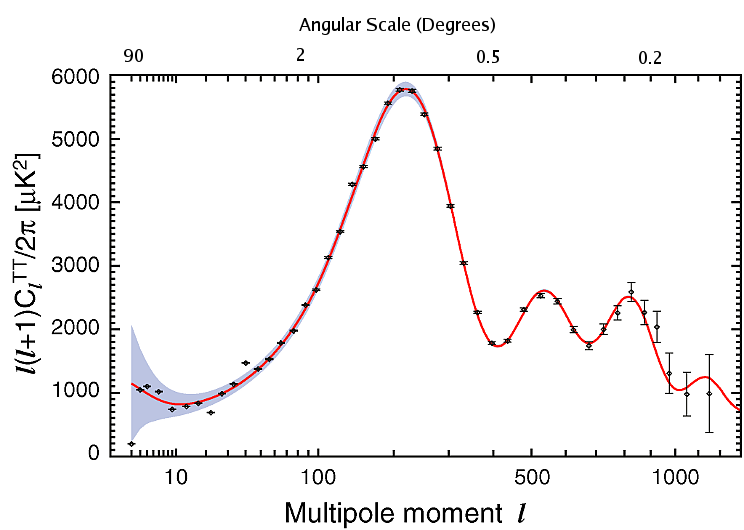
The horizontal scale is the multipole moment, denoted l; the angular scale is actually π/l, so larger values of l denote smaller angles. The vertical scale is the temperature correlation function Cl, multiplied by l(l+1)/2π, and is measured in μK2, or (10-6K)2. The blue region represents the range of data values within one standard deviation of the fit line.
The peaks in the power spectrum are called acoustic peaks, and indicate the length scales of the oscillations in the plasma before the temperature fluctuations froze out in the last scattering surface (at decoupling). The height and positioning of the peaks are influenced by a number of cosmological parameters. We will focus on the following:
In addition, any parameter which affects k (primarily the Ωs) changes the angular scales we observe. Photons of the CMBR follow geodesics; the Geodesic Equations for the FRW metric tell us that the rate an angle changes is inversely proportional to the square of the scale factor. From the graphs above, we can see that smaller values of k cause the power spectrum to shift to higher values of l.
Note that the length scales corresponding to the acoustic peaks should correlate with the distances between large structures in the universe. Survey results have recently begun to confirm that expectation.
After you run CMBFAST (which may take a few minutes), your results will be returned to you. Look for the number on the "Output Files" (ie., "02036736" in "cmb_02036736.fcl"). Enter that number in the applet below and it will load the power spectrum data and plot it. Each time you enter a different number, it will be plotted in a different color (from red to violet). The best fit plot is plotted in black.
We have ignored changes in the temperature anisotropy due to gravitational lensing. We have also ignored ionization from early hot clusters, and gravitational red shifting from the galaxy foreground (between us and the last scattering surface). Finally, all of our deliberations are strictly with the temperature anisotropies; there are also polarization anisotropies: deviations in the electric field and magnetic field directions in the CMBR. These promise to be important sources of information in future studies.
Capture images of each of the comparison plots
for the 4 investigations, and annotate them, describing which plots belong to which parameter values.
Portfolio Exercise:
Using CMBFAST and the comparison applet, perform the 4 investigations listed
above the applet. Do at least 4 trials for each investigation. Be sure that Omegab is greater than 0 for each trial.
What is the relationship between the results of investigation number 3 and the geometry of the universe?
Include all 4 in your portfolio.
The Planck Collaboration has recently released data
from their first 15.5 months which estimate the Hubble parameter (H0) at 67.15 km/s/Mpc, Ωb at 0.049,
ΩCDM at .268 and Ωvac at .683. Run CMBFAST with this profile and compare it to the others.
Include it in your portfolio.
The Sunyaev-Zel'dovich effect
In a galaxy cluster, the spaces between galaxies is filled with hot gas.
When photons from the CMBR interact with that gas, they pick up additional energy. This
results in "holes" in the CMBR:
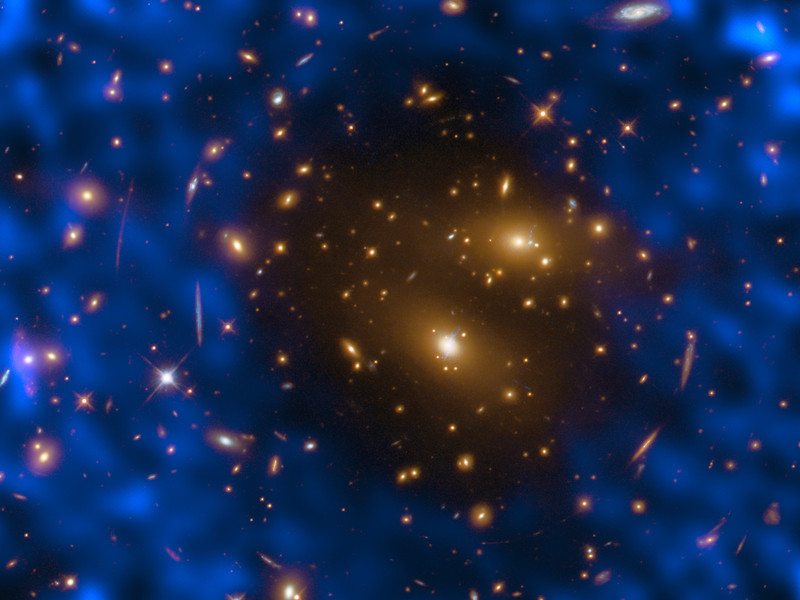
Here, blue represents the CMBR.
At re-ionization, the speed of sound was about 10 km/s, so halos with escape speeds less than that (around 108 Msolar) didn't form stars (the gas would not fall into the halos).
Star formation drove gas out of the galactic halos (accounting for the presence of heavy elements in the intracluster medium); this process was aided by ram pressure as the galaxies moved through the intracluster medium.
©2017, Kenneth R. Koehler. All Rights Reserved. This document may be freely reproduced provided that this copyright notice is included.
Please send comments or suggestions to the author.