
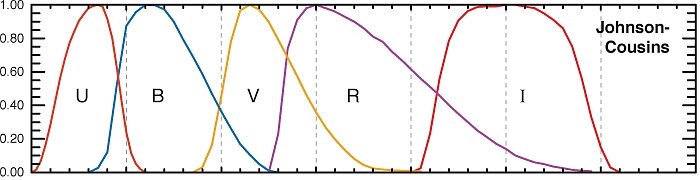
Also denoted the ubvri photometric system, it breaks the electromagnetic spectrum into five bands which correspond to the wavelengths passed by filters in the near ultraviolet ("u"), blue ("b"), "visual" ("v"), red ("r") and near infrared ("i") ranges. The v band is particularly important, for it is often used to determine the apparent magnitude. At a distance of 10 pc from a star, the apparent magnitude
m = 4.83 - 2.5 * log10 luminositysolarwhere the luminosity is the total energy output in the v band, relative to that of the Sun. Often m is computed at a specific wavelength, near 5448 A, which is an "effective" central wavelength representative of the band.
But filters on many telescopes, including the Hubble, are much more specific, concentrating on narrow emission wavelengths corresponding to specific elements, ions and molecules. For instance, the famous image of the "Pillars of Creation" (stellar nurseries in M16, the Eagle Nebula) was taken first as black and white exposures through filters corresponding to:
These were then colored red, green and blue, respectively, and digitally added to produce the final image. This has become a commonly-used color palette for images of nebulae.
The natural red color of this emission nebula arises from Hydrogen emissions at 6563 Angstroms (called "H-Alpha"). These emissions are powered by ultraviolet radiation from hot stars, whose winds help to create the shapes and shock waves characteristic of so many nebulae; the radiation ionizes Hydrogen atoms, and the red emission results when the ionized electrons recombine with the Hydrogen nuclei. Light from blue reflection nebulae, in contrast, is reflected from dust grains which, like our atmosphere, scatter blue light more efficiently than other colors. M42 (The Orion Nebula) and M20 (The Trifid Nebula) provide good examples of both types, as well as molecular dust lanes.This Java applet shows how red, green and blue images can be composited back into a multicolor image. It is an illustration of the RGB color model: by adding different amounts of the three fundamental colors, you can produce (in this program) one million different shades ("True Color" on a computer monitor is considered to be 224 = 16,777,216 shades, although professional photographers work with 248, or over 281 trillion shades!).
It is also possible to enhance contrast in an image without modifying the color content. In addition to the examples above, false color can also be used to composite images from multiple instruments:
 | Reconstructed black and white image of M 16, Sulfer+ emission filter. | |
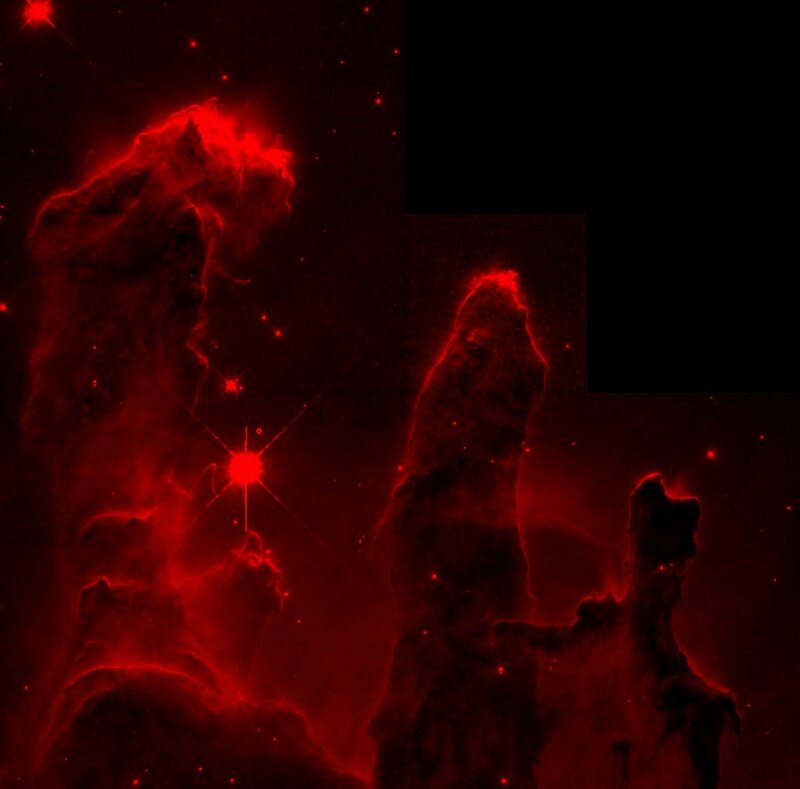 | Red channel of false color image of M 16 (Sulfer+ filter). | |
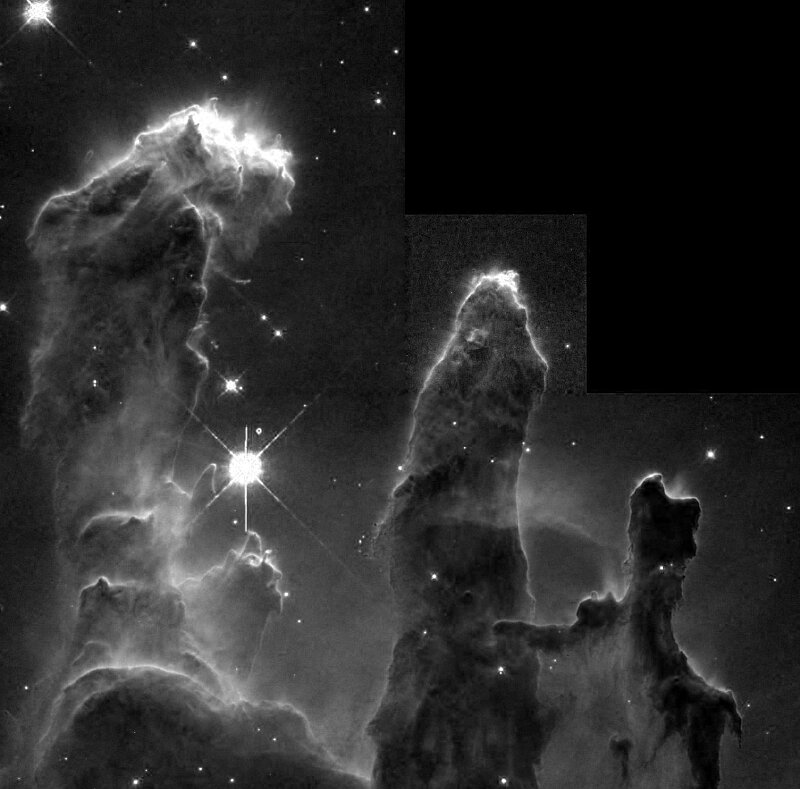
 | Reconstructed black and white image of M 16, Hydrogen emission filter. | |
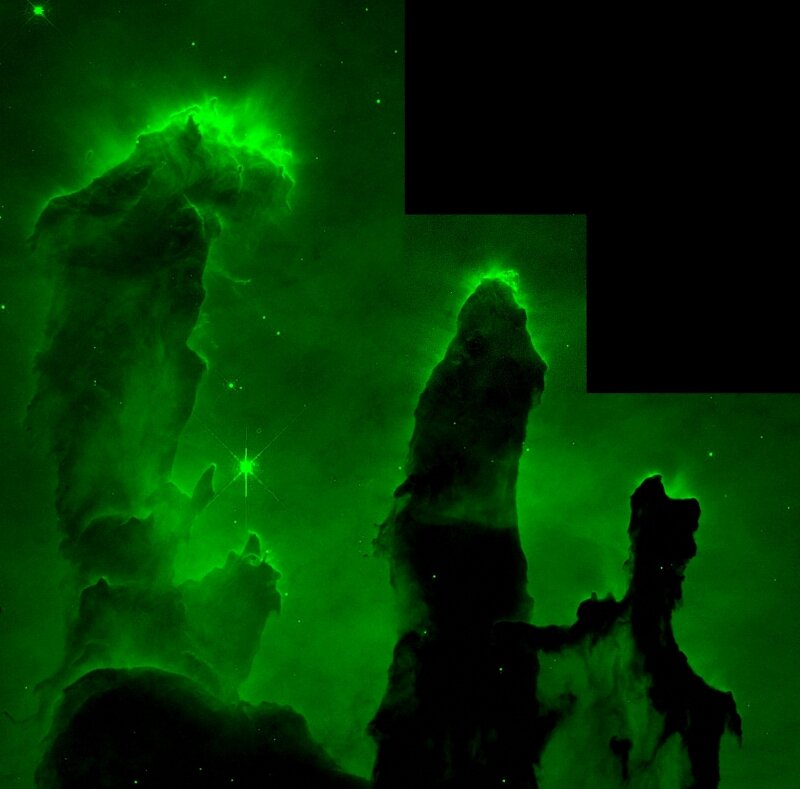 | Green channel of false color image of M 16 (Hydrogen filter). | |
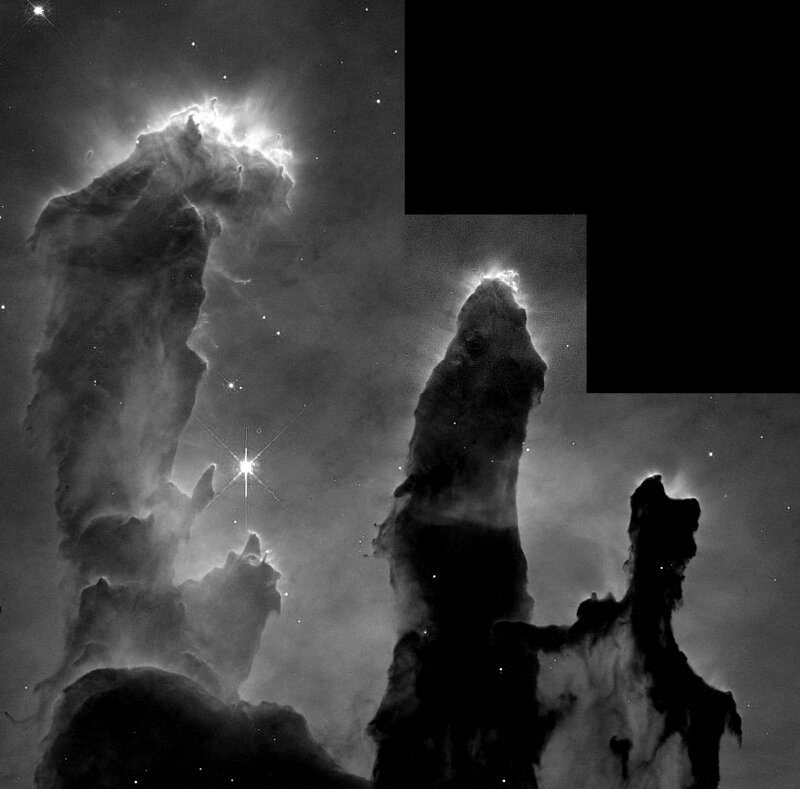
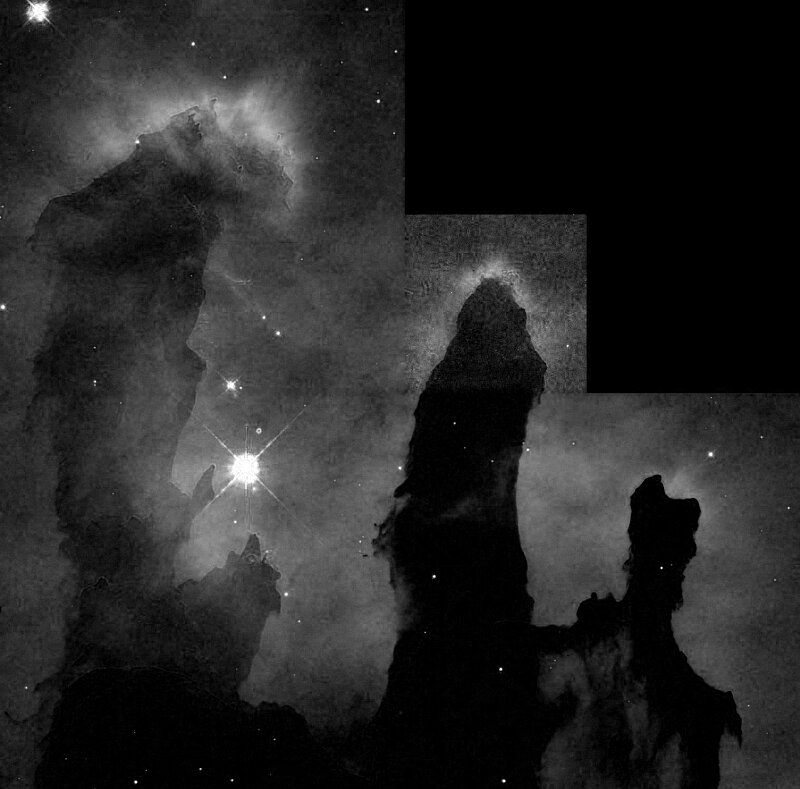 | Reconstructed black and white image of M 16, Oxygen++ emission filter. | |
 | Blue channel of false color image of M 16 (Oxygen++ filter). | |
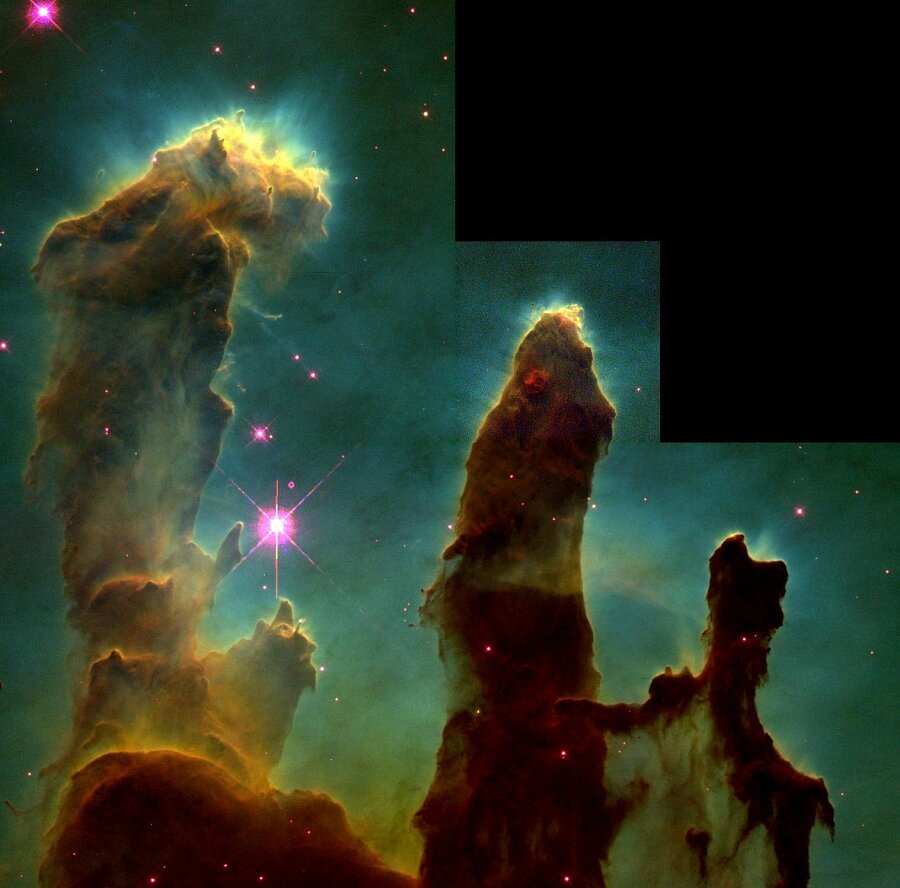 | Composited false color image of M 16. | source |
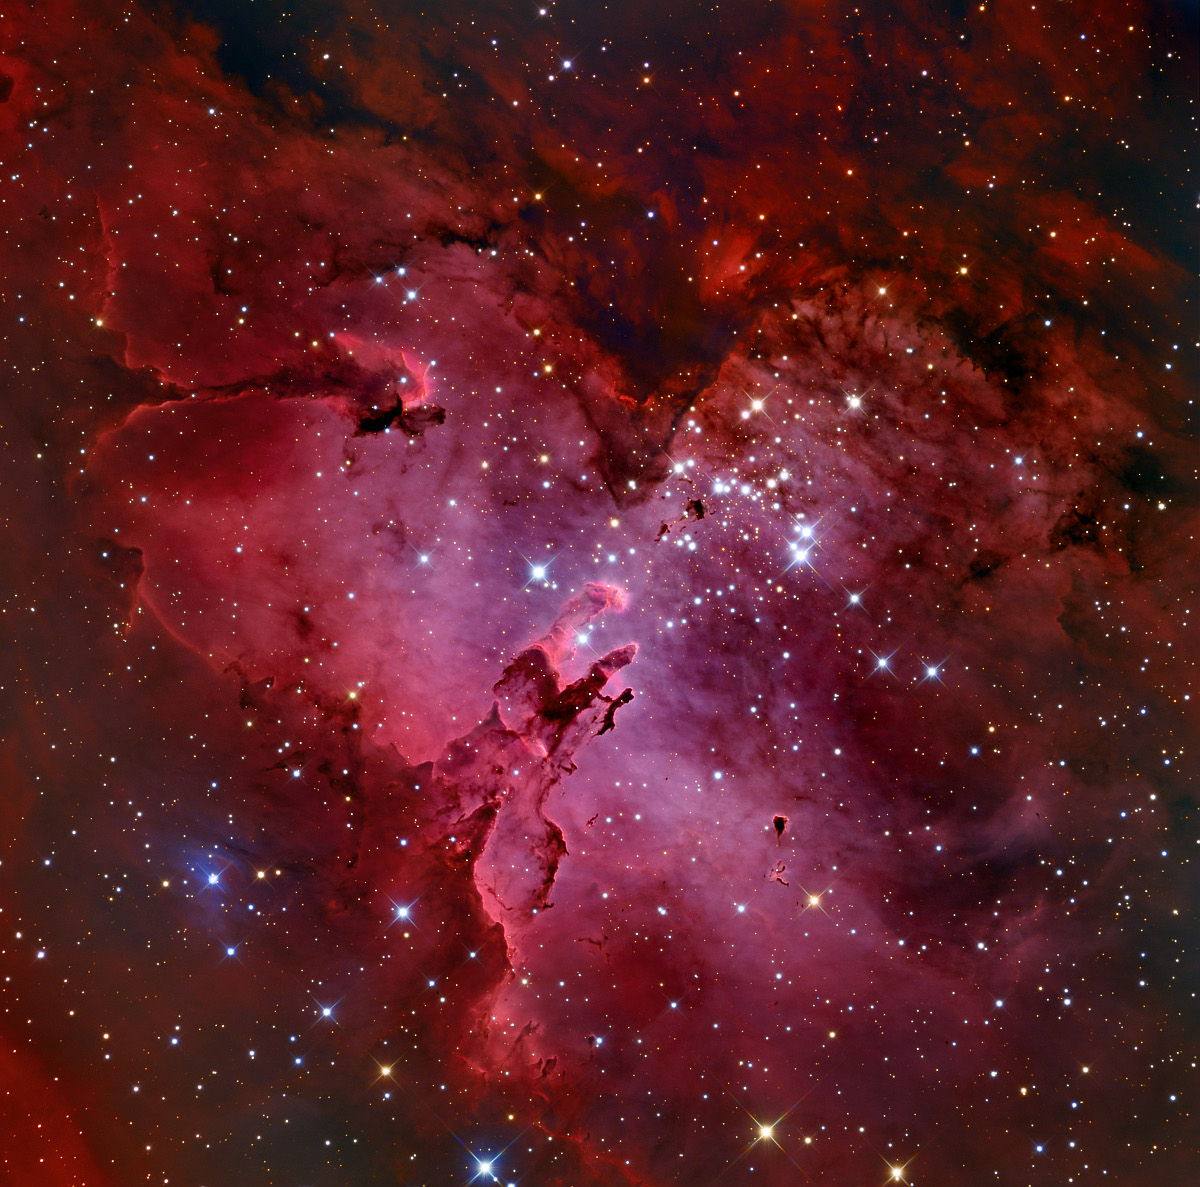 | True color image of M 16. | source |
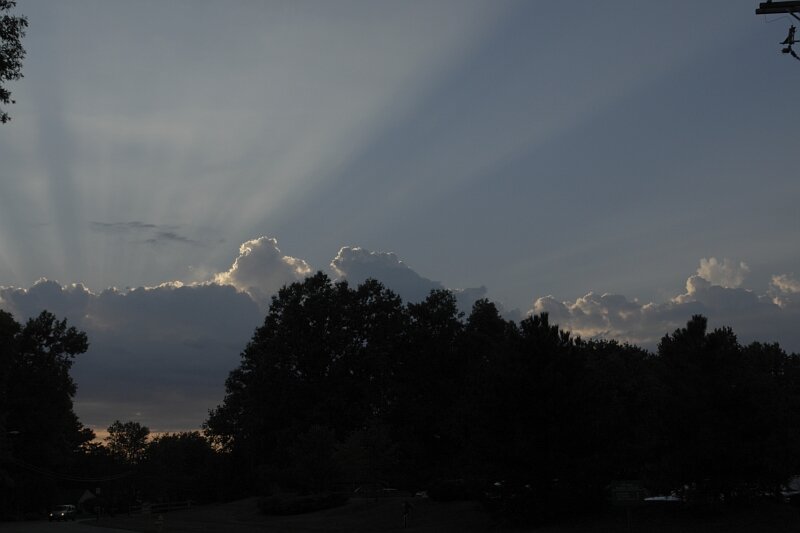 | Clouds in Cincinnati, original image. | |
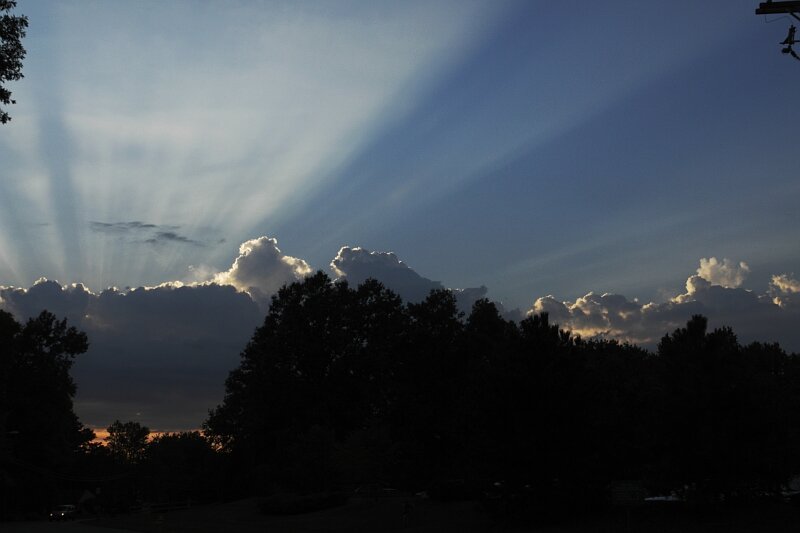 | Clouds in Cincinnati, midtone contrast stretched. | |
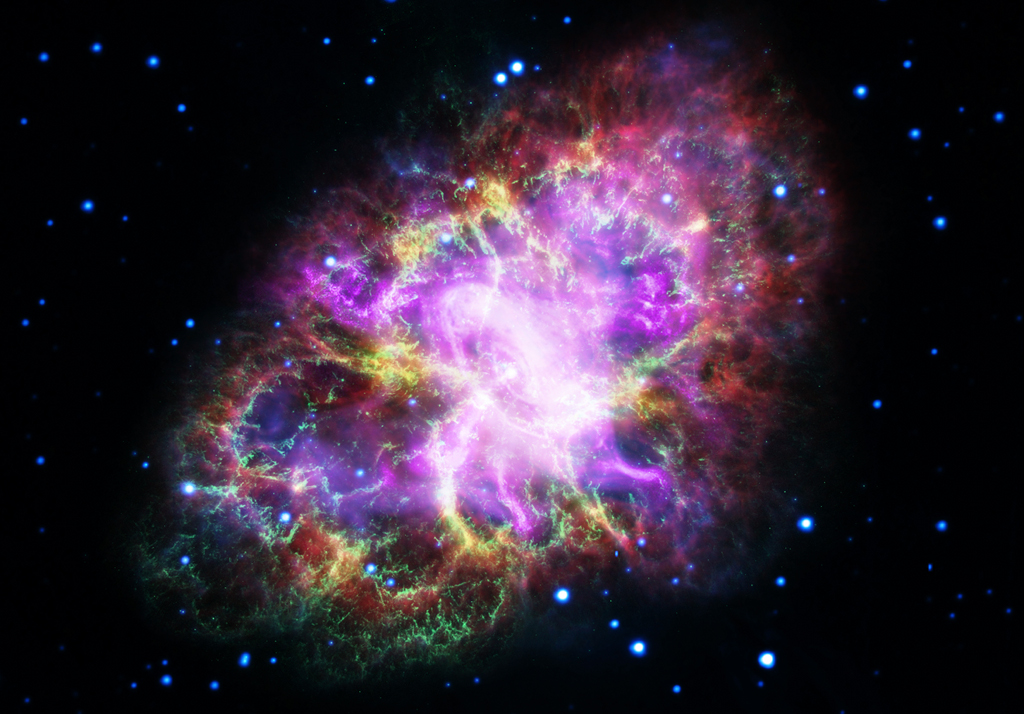 | M 1 (the Crab Nebula), with radio in red, infrared in yellow, optical in green, ultraviolet in blue and x-ray in purple. | source |
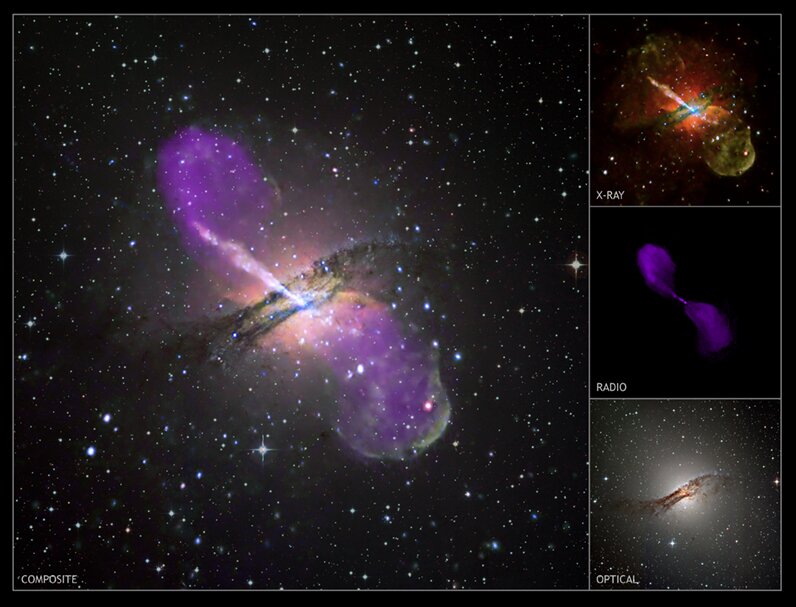 | NGC 5128 (Centaurus A) in optical, IR (36000-80000 A), radio (20 cm) and x-ray (R = 12.4-24.8 A, G = 9.3-12.4 A, B = 6.2-9.3 A). | source |
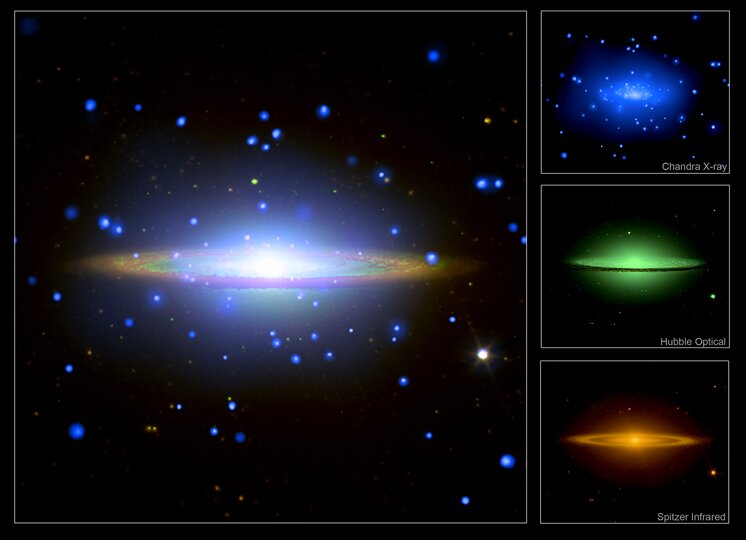 | M 104 in optical, IR and x-ray. | source |
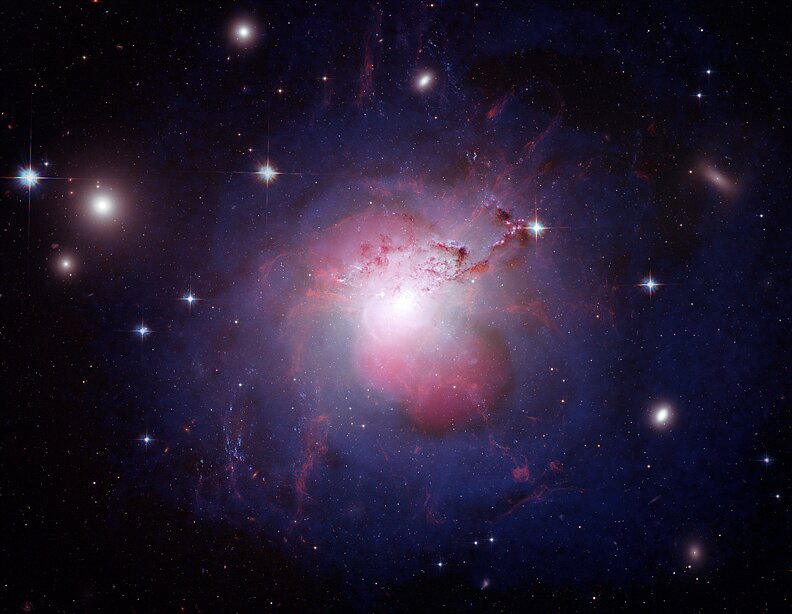 | Perseus A in optical (Hubble ACS), x-ray (violet, Chandra ACIS) and radio (pink, VLA). | source |
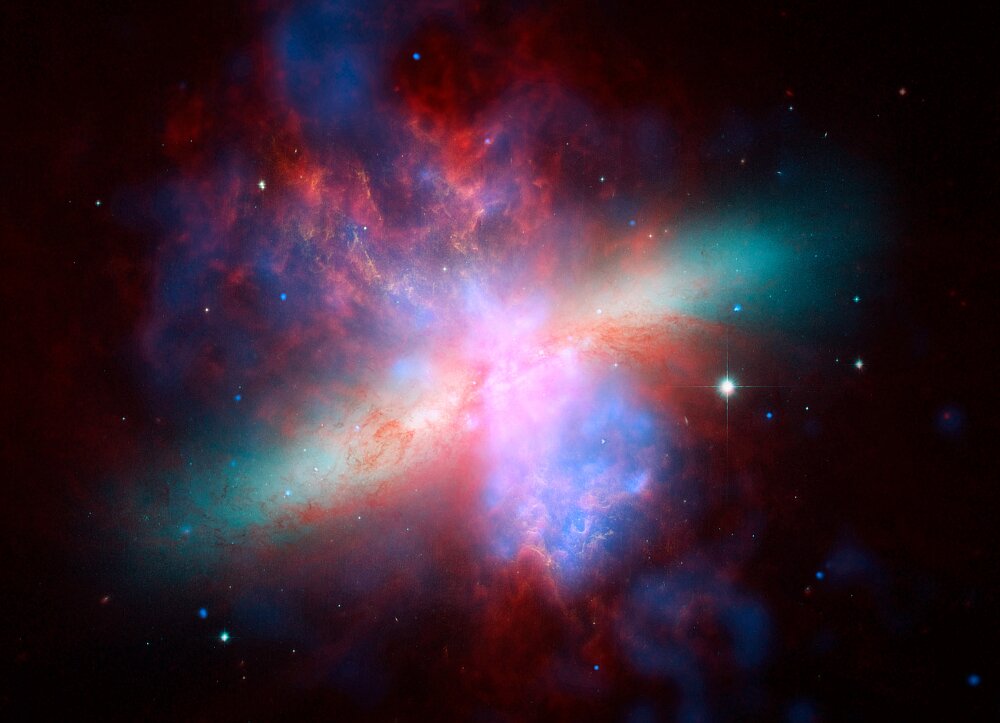 | M 82 in optical (Hubble), IR (Spitzer IRAC, red) and x-ray (Chandra, blue). | source |
©2017, Kenneth R. Koehler. All Rights Reserved. This document may be freely reproduced provided that this copyright notice is included.
Please send comments or suggestions to the author.