
Using our temperature of 9300 K from the Spectrum Viewer, we see that 108 Virginis is likely close to a class A1 (interpolating between the temperatures for A0 and A2 in the graph).
absolute magnitude = 4.83 - 2.5 * log10 luminositysolarFor 108 Virginis, at a distance of 188.3 parsecs and a luminosity of 110 Lsolar, we obtain an absolute magnitudeabsolute magnitude = apparent magnitude + 5 - 5 * log10 distancepc
M = 4.83 - 2.5 * log10 110 = - 0.27and an apparent magnitude of
m = - 0.27 - 5 + 5 * log 10 188.3 = 6.1Note that because of our underestimate of the luminosity, M is larger (less negative) than it should be, and m is also larger than it should be. Here the error is even less than in our radius calculation because the log function increases more slowly than the square root.
Standard luminosity classes are
A spectral class beginning with "D" indicates a degenerate star, or white dwarf: a star which has collapsed to a small, hot cinder after fusion processes have stopped. Additional designations include "e" (has emission lines), "n" (has diffuse lines), "p" (has a peculiar spectrum; even physicists don't understand it all yet!), "s" (has sharp lines), and "v" (variable star).The following table relates the absolute magnitude to the luminosity class for each spectral class (the magnitudes given are the most likely values for each class):
Using the estimated class A1 for 108 Virginis, we see that it could conceivably be a main sequence star, a supergiant, or a white dwarf. Given an absolute magnitude of -0.27, it is much more likely that it is a main sequence star.
Using SIMBAD, you can look up the accepted spectral class for 108 Virginis. You will find it listed as "B9.5V". Our choice of A1 is very close to B9.5, and the "V" indicates a main sequence star, so our choice of luminosity class was correct.
For each star, compute the absolute and apparent magnitudes. Assign a luminosity class to each star.
Look each star up on SIMBAD. Comment on your success rate.
Another thing to notice is that the white dwarf region of the diagram is distributed over a relatively wide range of luminosities
and temperatures. This means that knowledge of temperature does not translate as easily into knowledge about luminosity as it does with main sequence
stars. At first glance one might be tempted to
say the same thing about the giant and supergiant regions, but because they represent definite paths in the life cycles of
those stars, and the stars themselves are much larger and brighter, they do not represent so much of a problem.
Portfolio Exercise:
Using the information you have collected so far, assign a spectral class to each of your stars from the spectra portfolio exercises.
The Hertzsprung-Russell Diagram
Suppose you could take a picture of every person on Earth at a given instant of time. Armed only with that picture,
you must find a model that explains the human life cycle, from conception to death.
The Hertzsprung-Russell Diagram is like that picture, and with it we can learn some things about the lives of stars.
Note that it is like a mirror image of the graph above:
A Hertzsprung-Russell Diagram. (source)
The position of a star on the main sequence (the line from upper left to lower right) is determined by its mass.
Main sequence stars of spectral type G0 are about 1 Msolar, while those of type B0 are about 15 Msolar
(stars begin their main sequence lives with masses varying from 0.07 to about 200 Msolar
(source)). Almost half of the
stars in the neighborhood of our Sun have a mass less than about a third of the Sun's;
about one in 300 of the neighborhood stars have a mass in excess of 8 Msolar.
The first thing to notice is that by far, most of the data points lie on the main sequence. Since we are looking at
a population of stars at a different time in each star's life, that tells us that stars spend
most of their lives on the main sequence. As a consequence, the (super)giant and white dwarf regions of the diagram
must represent stars at various stages near the ends of their lives (assuming that most of the data points represent
stars and not protostars).
The main sequence ends at about 2100 K.
Below that temperature are larger brown dwarfs: "failed" stars,
which have insufficient mass to initiate fusion.
Straight diagonal lines parallel to the tangent at the center of the main sequence correspond roughly to lines
of equal radius. Our B0 main sequence star has a radius around 10 Rsolar. The spacing of these lines of
equal radius is roughly logarithmic.
We can learn much about the populations of stars in a galaxy like ours by looking statistically at the stars we know best: those closest
to us. Using a recent survey (source), we have culled
spectral class, apparent magnitude and parallax data for 3633 stars near the Sun. This data is available in an
Excel spreadsheet. Using the parallax data, you can compute each star's distance from Earth as
distancepc = 1000 / parallaxmasFrom the relation
absolute magnitude = apparent magnitude + 5 - 5 * log10 distancepcyou can then compute each star's absolute magnitude. The absolute magnitude can be used to determine the luminosity from the relation
absolute magnitude = 4.83 - 2.5 * log10 luminositysolaras
luminosity = 10(4.83 - absolute magnitude) / 2.5Assuming that luminosity is approximately equal to mass3.5, you can then compute each star's mass as
masssolar = luminositysolar(1/3.5)
Portfolio Exercise: Create a histogram of the spectral classes of this population of stars. Omit stars with spectral classes other than O, B, A, F, G, K or M, and stars with a range of possible classes. Include stars of all subclasses in the main class (ie., count M and M1 through M9.5 all as class M). Note the percentage of stars for which there is no subclass; what does this say about the difficulty of stellar classification?Create a histogram of the known luminosity classes of this population of stars. Omit stars with luminosity classes other than I-V and D/SD (white dwarf and sub-dwarf, sometimes designated VII and VI, respectively). Note the percentage of stars for which there is no luminosity class; what does this say about the difficulty of luminosity classification?
Create a histogram of the masses of this population of stars. What is the average mass to luminosity ratio (in solar units)?
Stellar clusters are groups of stars which are gravitationally bound (possibly very loosely). Clusters can be
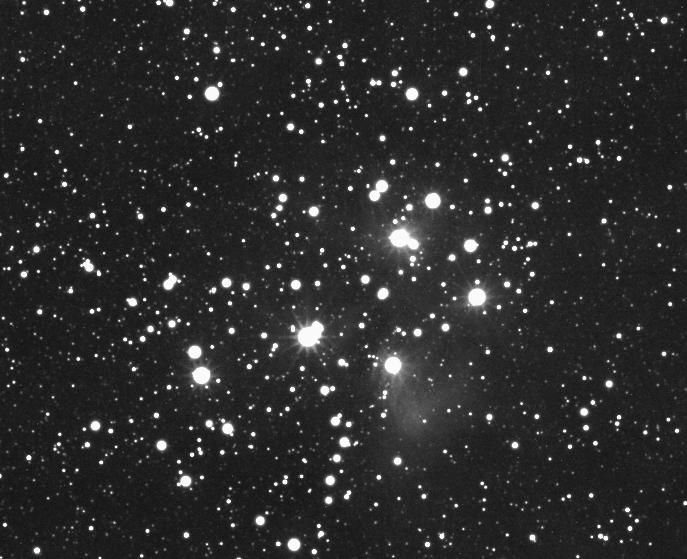 | The Pleiades (M 45), an open cluster. | source |
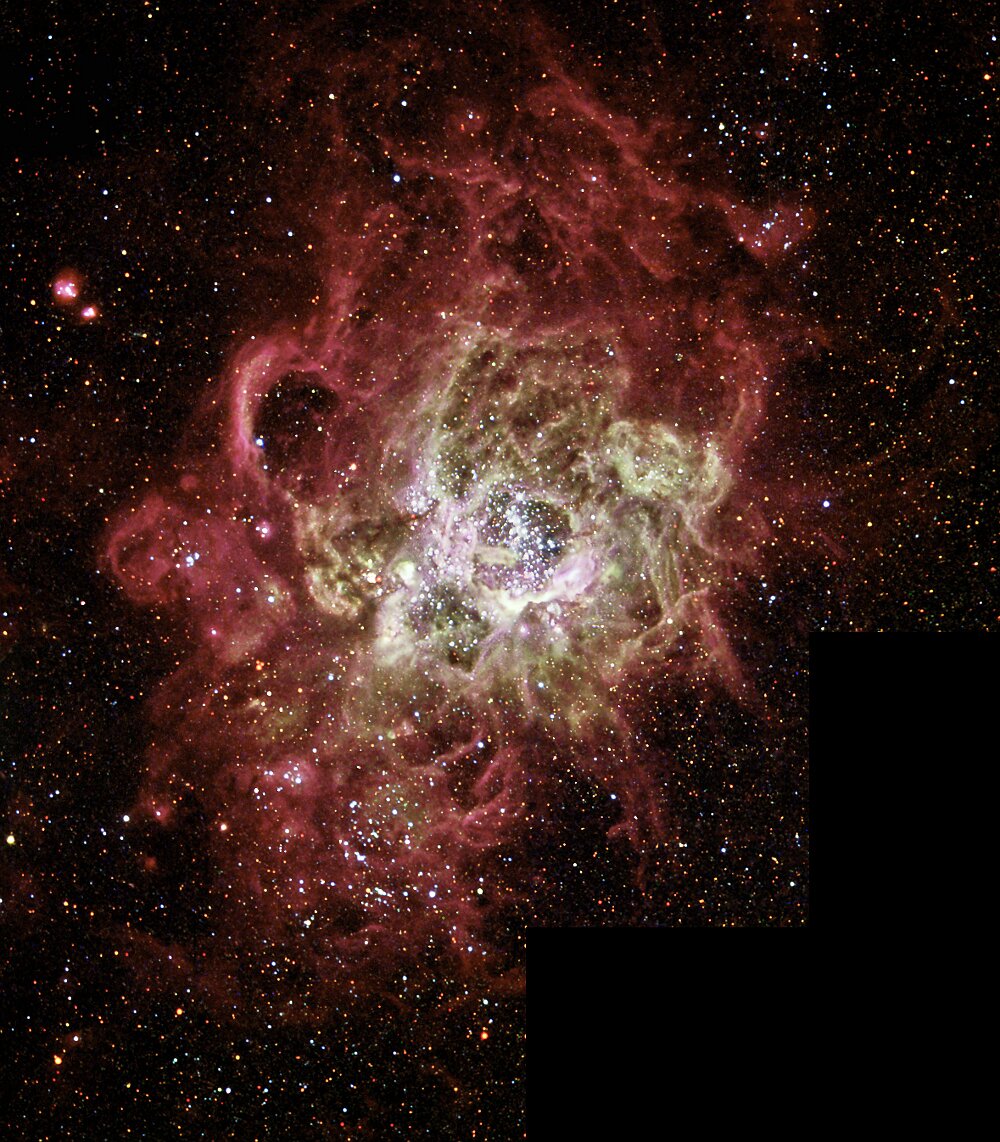 | NGC 604, near M33, a young cluster still within its birth cloud. | source |
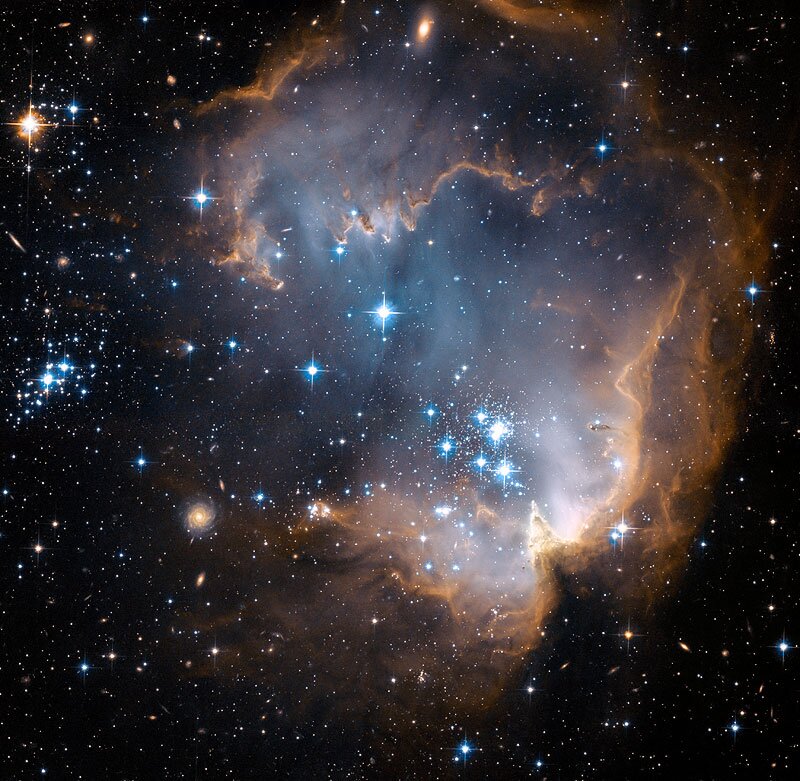 | NGC 602, where radiation from young cluster members is triggering more star formation. | source |
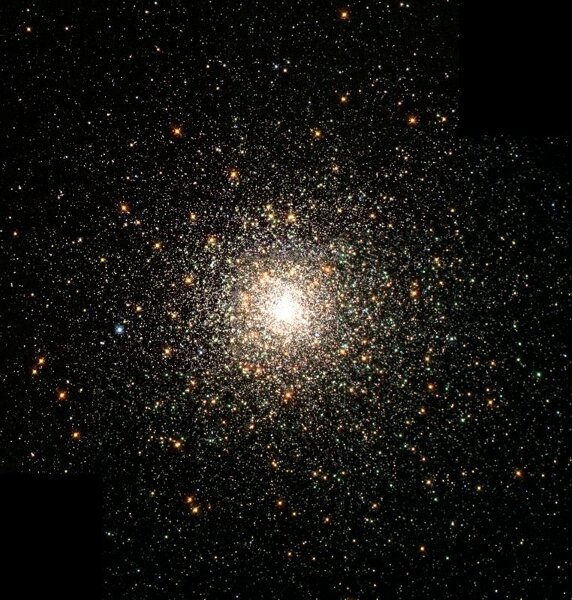 | Globular cluster M 80, with many old red giants and a few blue giants, possibly the result of stellar mergers. | source |
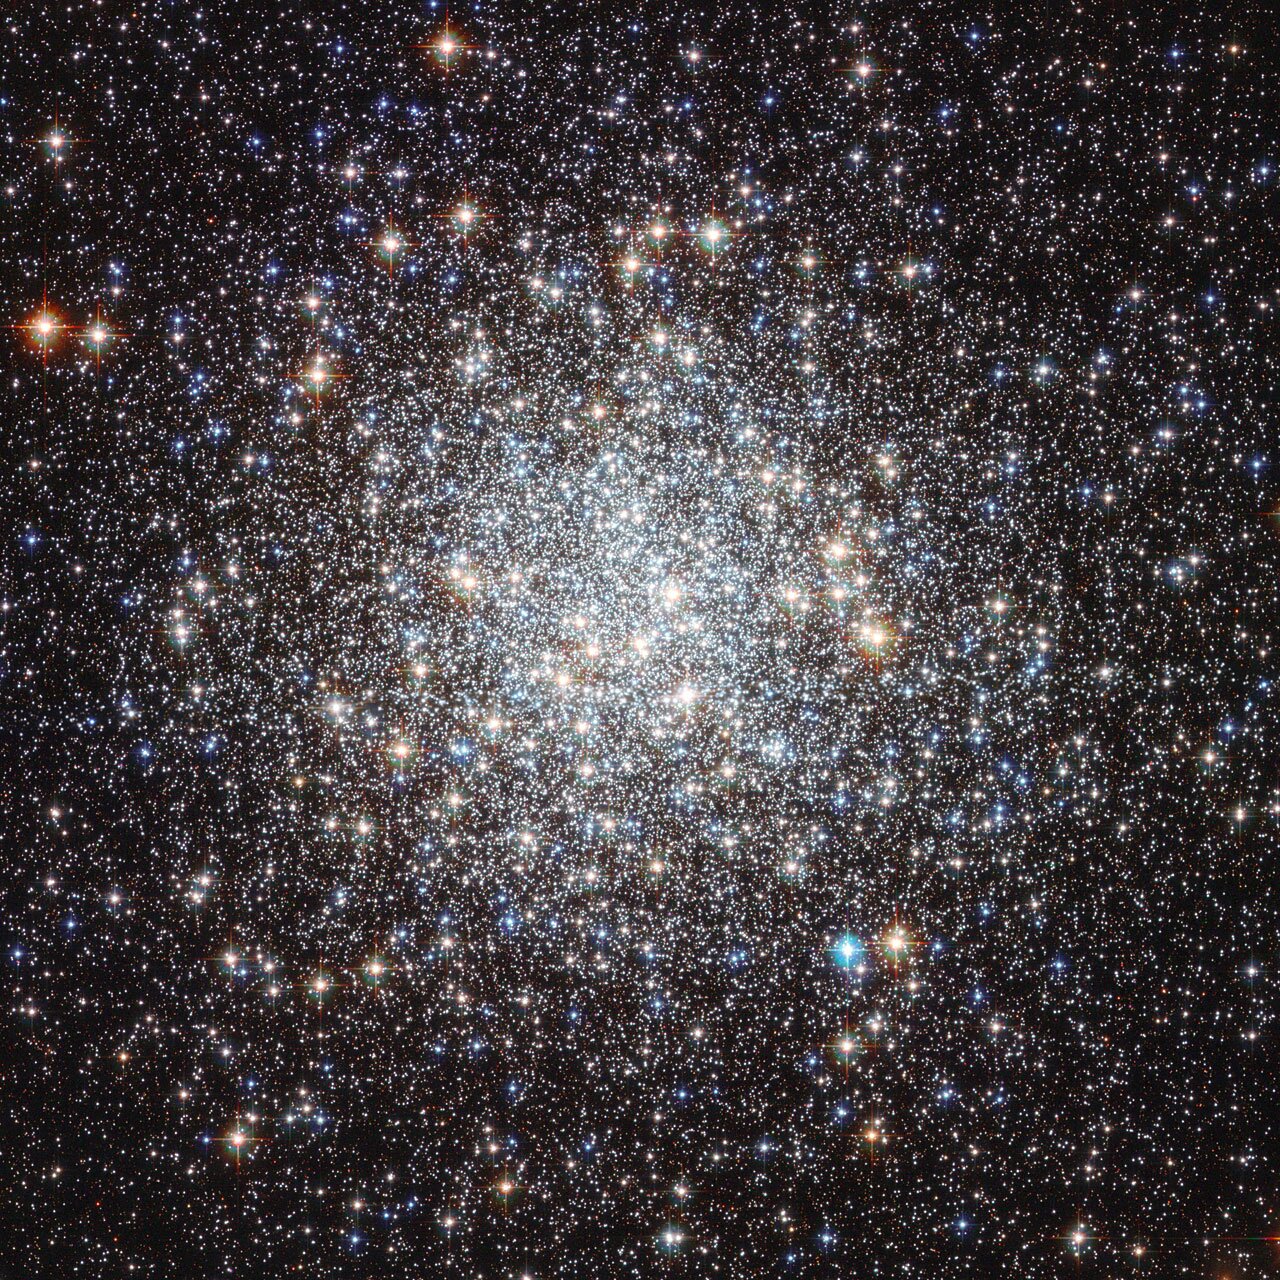 | Globular cluster M 9, with fewer red giants. | source |
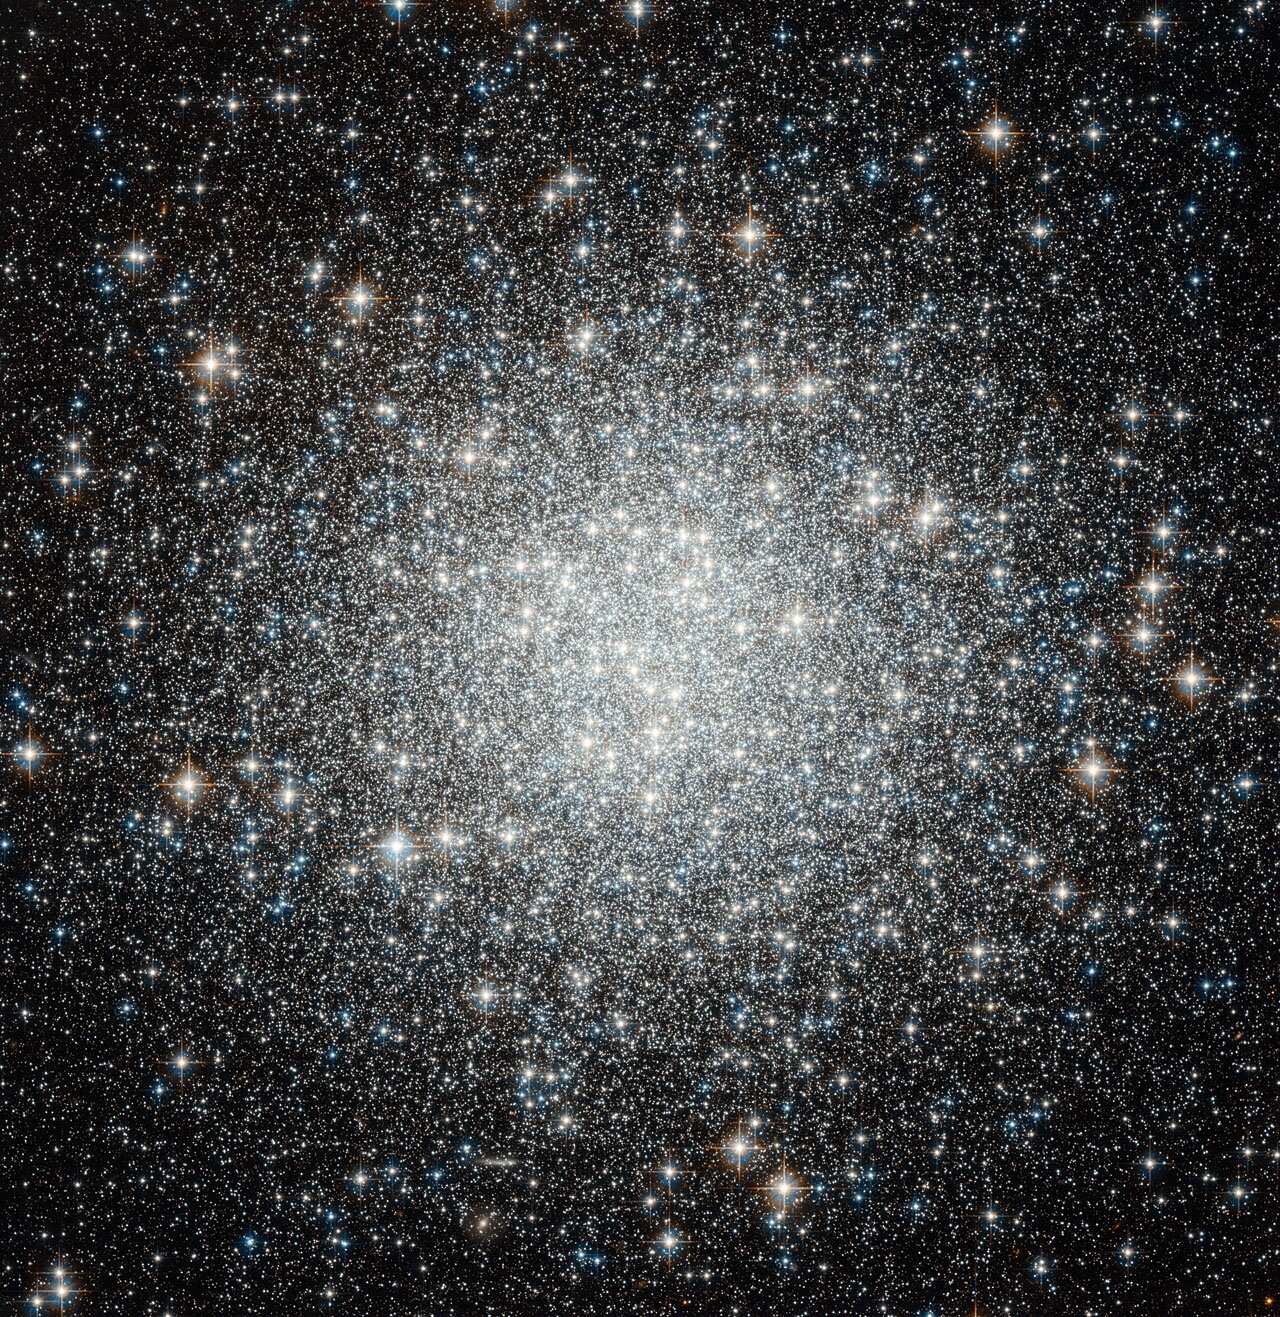 | Globular cluster M 53, with an unusual number of blue giamts ("stragglers"). | source |
©2013, Kenneth R. Koehler. All Rights Reserved. This document may be freely reproduced provided that this copyright notice is included.
Please send comments or suggestions to the author.