
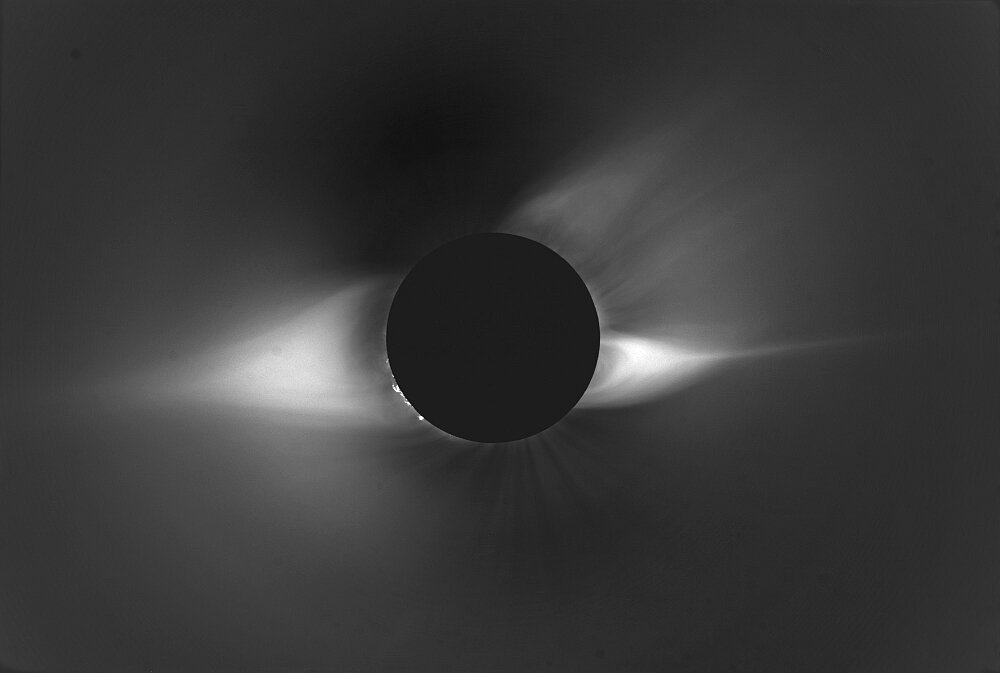
(View Cosmos DVD 5, episode 9, on solar activity)Here are a number of movies of the Sun. Look for granules (convection cells with dark edges where cooler gases sink), spicules (vertical "spikes"), coronal holes (large areas of low density where the Sun's magnetic field opens outward, allowing outflow of the solar wind) and filaments ("curves" following magnetic field lines above the surface):
The magnetic fields of astronomical bodies are thought to be generated by the movement of conducting fluids. In the case of the Earth, this is the liquid Iron in the outer core, and results in the reasonably regular dipole field we observe, with its North and South magnetic poles.
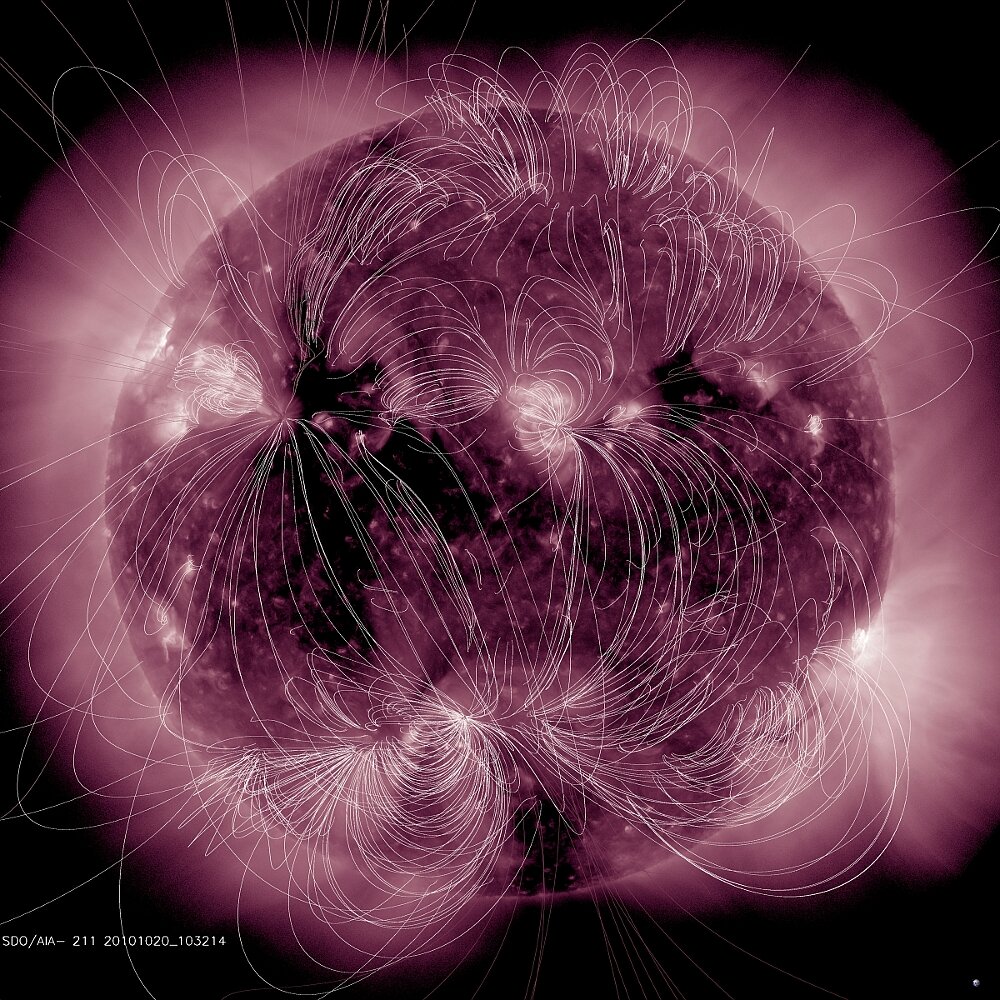
The case of the Sun, however, is much more complicated. In addition to the Sun's differential rotation, in which the rotation speeds vary with latitude, the conducting plasma responsible for the Sun's magnetic field undergoes radial as well as polar convection in the outer 30% of the Sun's radius. The result is much more chaotic, where field lines are warped and often reconnect with violent results:
Especially strong magnetic fields inhibit convection, and so their poles on the solar surface are cooler and appear darker (although the regions surrounding them are usually much brighter in ultraviolet). These are the familiar sunspots.
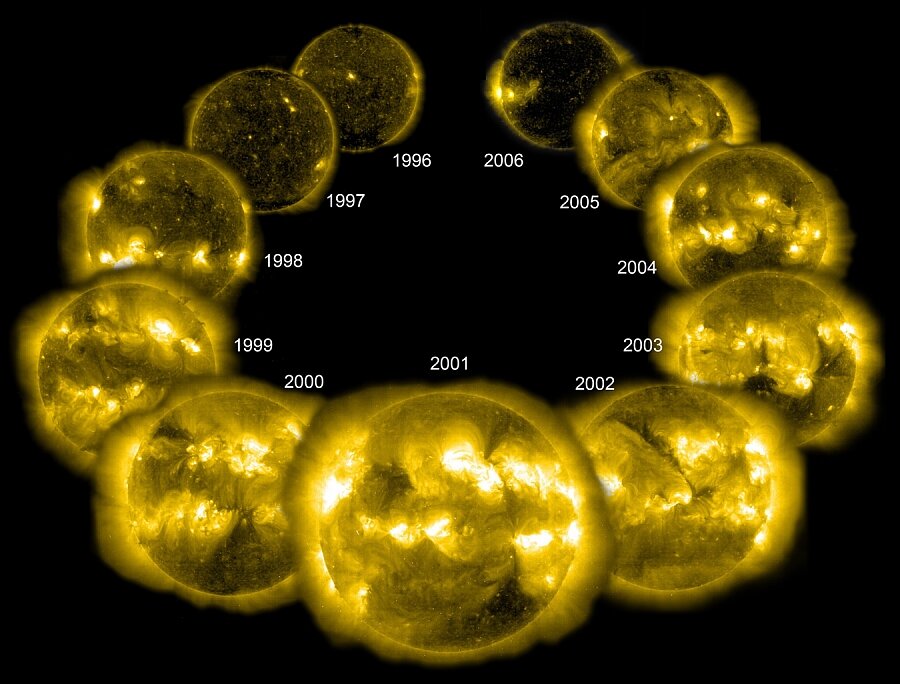
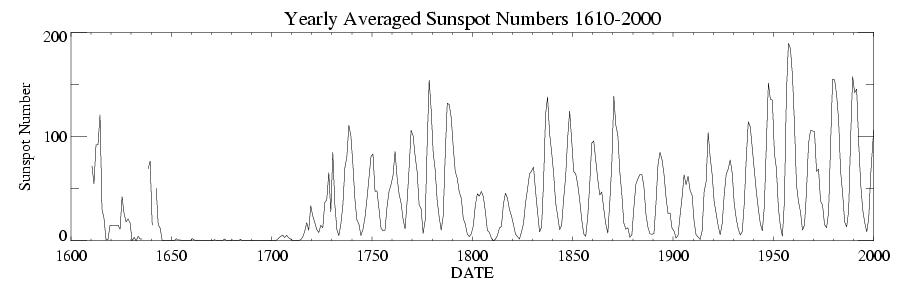
Sunspots come and go in 11 year cycles:
Note the Maunder Minimum between 1645 and 1715:
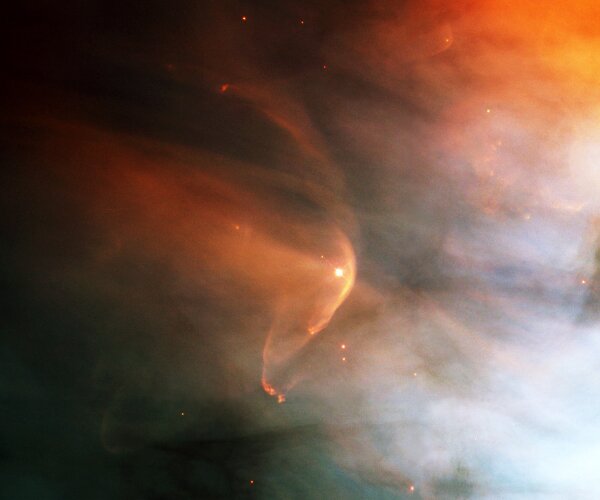
At the start of each new cycle, the polarity of sunspot "pairs" reverse. For instance, during the cycle which is beginning in 2008, active regions in the northern hemisphere are oriented so that their south poles are west of their north poles (the opposite occurs in the southern hemisphere). In the previous cycle, the order was reversed. Here is a SOHO movie of magnetic fields from May 1998 (8.37 MB) (source).The solar wind, particles streaming from the surface of the Sun, gives us auroras and comet tails. It is a ubiquitous phenomenon, especially in hot young stars like LL Orionis:
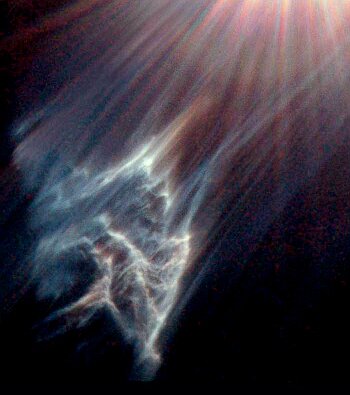
The solar wind speed is around 400 km/s, which is about 2/3 of the escape velocity at the surface of the Sun. The wind, however, starts from the corona, which extends several solar radii; the escape velocity at 2.4 solar radii is 400 km/s. The current solar wind velocity is available from SOHO.Even radiation pressure sculpts the interstellar medium:During solar minimum, weakening solar wind allows cosmic rays to penetrate deeper into the Earth's stratosphere.The solar wind carries away about 10-14 solar masses annually. This is about 634 million kg per second. If the wind was entirely made up of protons, the outgoing flux would be 3.79 * 1035 protons per second. Assuming that they are emitted isotropically, we should detect an average of about 3.37 per cubic centimeter at the Earth. The measured value is actually about twice that.
Solar flares are classified using the following scheme of letters and numbers (n):
class Peak Intensity comments An n * 10-8 W/m2 A-class flares are approximately at background levels. Bn n * 10-7 W/m2 B- and Cn n * 10-6 W/m2 C-class flares are not strong enough to have much of an effect on the Earth. Mn n * 10-5 W/m2 M-class flares can cause polar radio blackouts, and can pose a health risk to astronauts. Xn n * 10-4 W/m2 X-class flares cause intense auroras and can damage electromagnetic equipment. Intensities are measured at wavelengths between 1 and 8 Angstroms.
©2017, Kenneth R. Koehler. All Rights Reserved. This document may be freely reproduced provided that this copyright notice is included.
Please send comments or suggestions to the author.