(View Cosmos DVD 6, episode 10, dramatization of red shift discoveries at Mt. Wilson.)In 1998 and 1999, the GHASP survey of spiral and irregular galaxies (source) measured the central wavelength and width of the Hydrogen-α line at 6562.78 Angstroms for the following galaxies in the UGC catalog (values were derived from the paper for the purposes of this text):
| UGC # | λcentral (A) | width (A) | diameterangular (am) | M | m |
|---|---|---|---|---|---|
| 2034 | 6575.29 | 2.43286 | 2.818 | -17 | 12.9 |
| 2080 | 6582.36 | 13.1647 | 5.754 | -19.5 | 11.2 |
| 3574 | 6594.17 | 6.98982 | 3.467 | -17.6 | 14.1 |
| 4325 | 6573.78 | 4.62356 | 3.388 | -17.7 | 12.1 |
| 4499 | 6577.66 | 3.3546 | 2.344 | -16.2 | 14.1 |
| 5253 | 6591.66 | 11.3157 | 4.168 | -20.8 | 10.8 |
| 5316 | 6585.16 | 5.77299 | 4.073 | -19.7 | 11.5 |
| 5721 | 6574.37 | 4.2076 | 1.819 | -16.9 | 12.6 |
| 5789 | 6578.75 | 5.30686 | 5.888 | -19.2 | 11.2 |
| 5829 | 6576.52 | 2.10449 | 5.128 | -17.1 | 12.9 |
| 5931 | 6597.89 | 8.18138 | 1.949 | -20.1 | 11.7 |
| 5935 | 6599.49 | 2.66179 | 3.715 | -20.3 | 11.5 |
| 5982 | 6597.1 | 9.7857 | 4.073 | -20.3 | 11.5 |
| 6778 | 6583.74 | 13.0248 | 4.073 | -20.6 | 10.4 |
| 7524 | 6569.74 | 3.10968 | 13.8 | -17.3 | 10.6 |
| 8490 | 6566.96 | 3.83073 | 4.677 | -17.7 | 11.1 |
| 9969 | 6617.91 | 14.6256 | 5.128 | -21.7 | 11.2 |
| 10310 | 6578.2 | 3.70572 | 2.884 | -17.4 | 13.1 |
| 12060 | 6582.29 | 4.21267 | 1.318 | -16 | 14.8 |
| 12754 | 6579.01 | 5.92111 | 4.073 | -18.9 | 11.5 |
(The angular diameter is taken to be the major axis length reported by SIMBAD.)
Let's take a closer look at UGC 2034. Using the relation for Doppler Shift:
apparent wavelength / actual wavelength = 1 + recession velocity / cwe can solve for the recession velocity
v = c * (λcentral / 6562.78 - 1)Using our relation between absolute and apparent magnitude, we can solve for the distance= c * (6575.29 / 6562.78 - 1)= 572000 m / s
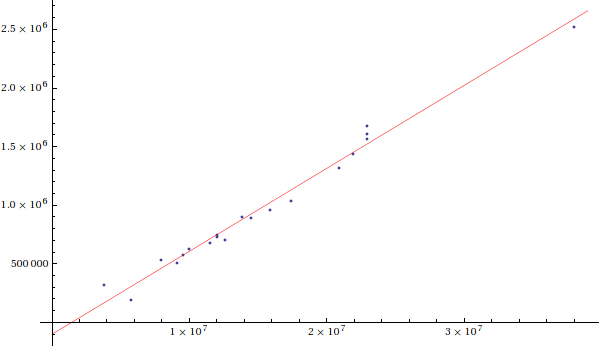
distancepc = 10(5 + apparent magnitude - absolute magnitude) / 5If we do this for all of these galaxies, and plot the recession velocities vs the distances, we get the following plot:= 10(5 + 12.9 - (-17)) / 5= 9.55 * 106 pc

The red line is the best linear fit to the data points, and its slope is called the Hubble Parameter:
H0 = 69.9 km/s / Mpc(this value is the current "best" value; see the References; the fit for our 20 galaxies had a slope of 70.783 km/s/Mpc).
It is common when dealing with distances on this scale to use the Hubble Relation
recessional velocity = H0 * distanceto compute the distance.
The Hubble Parameter has a value of approximately 69.9 km/s/Mpc. This is numerically equal to 2.265 * 10-18/s.
So its inverse, 1/H0, has a value of 4.415 * 1017 s, or 13.99 billion years. Up to a few technicalities
(which reduce the value to 13.78 billion years) this is the age of the universe.
Portfolio Exercise:
Recreate the Hubble Graph above for our sample of 20 galaxies.
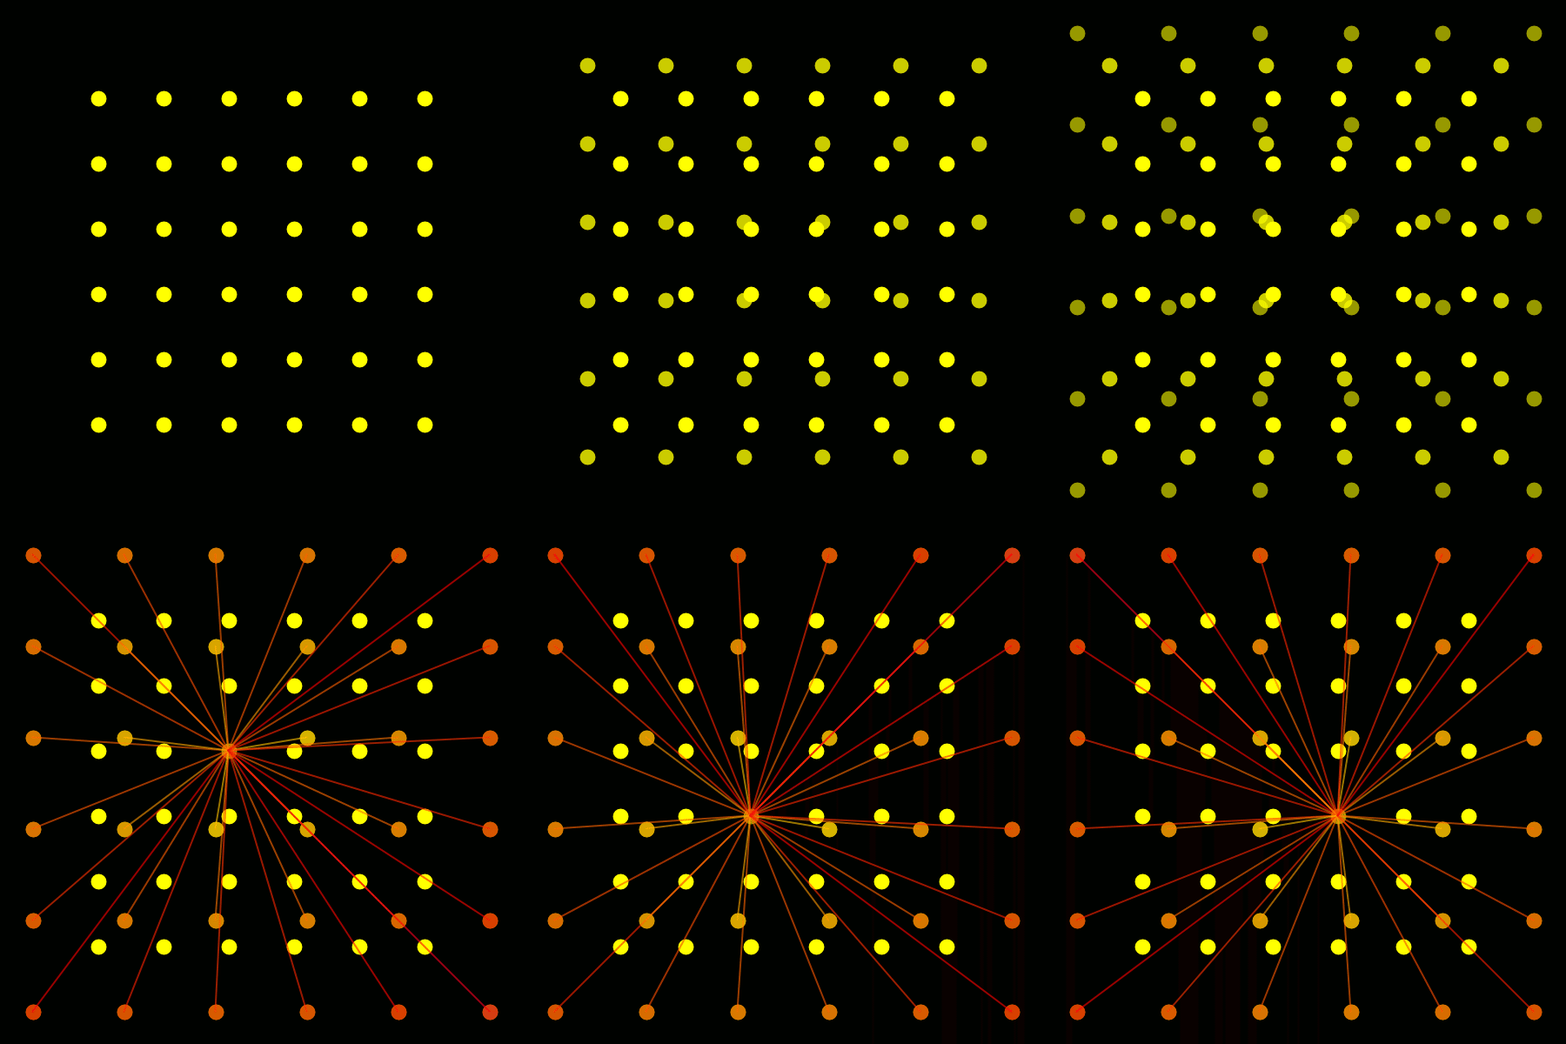
It is important to realize that our observation does not imply that we are at the "center of the universe". In
the following animation, we first see the effect of the expansion of the universe on a set of galaxies (marked by yellow dots). Then
for four sample galaxies, we draw lines to all of the other galaxies, color-coded by distance (greater distances appear more red). It
is clear that from any galaxy's point of view, all of the other galaxies are receding, with those most distant
receding fastest:

(View Cosmos DVD 1, episode 1, on the Cosmic Calender.)
Dealing with cosmological distances is quite a more difficult matter. As we have seen, the universe is expanding, and the
rate of expansion increases with the distance. The expansion is described by the scale factor, denoted "a"; if
rnow is the distance between two objects now (when, by definition, a is 1), then the distance between those objects at a different time is
rthen = rnow * athen / anow
The scale factor is related to the red shift (denoted "z") by the equations
= rnow * athen.
z = apparent wavelength / actual wavelength - 1
So we see that, as with any distance, wavelengths stretch with the expansion of the universe,
and the current red shift has a value of zero.
If the Big Bang model of the universe is correct,
and the universe began with infinitesimal volume, the red shift at the Big Bang is infinite.
= anow / apast - 1
Comparing the equation for red shift to our equation for the Doppler Shift, we see that when the recessional velocity is equal to the speed of light, the red shift is 1. Near this region the Hubble Relation breaks down, and relativistic effects must be taken into account. For this reason, it is most appropriate for us to discuss distances not in terms of meters or light years or parsecs, but instead in terms of red shift, which is based on direct observation, and does not depend on the scale factor of the cosmological model involved.

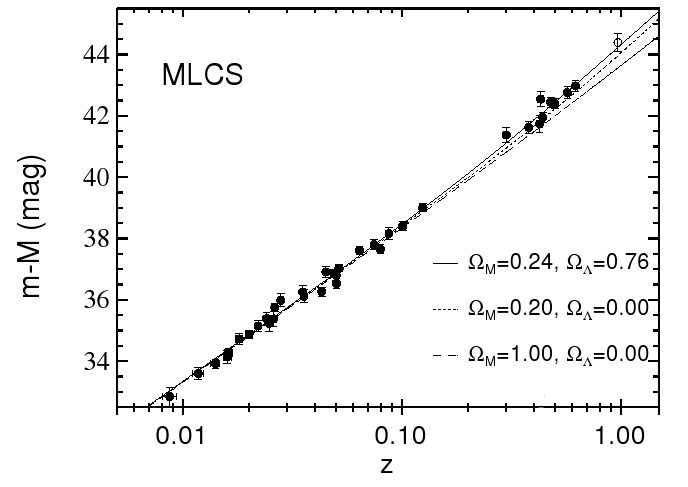
The data follows the upper line, which is a fit to a model in which the expansion of the universe accelerates due to something called the Cosmological Constant: a constant energy density which acts like a negative pressure.
In General Relativity, pressure acts like mass or energy, and so causes gravitational attraction. Negative pressure therefore causes repulsion.This was the first evidence that the expansion of the universe is accelerating. As we shall see, further data collected by the Wilkins Microwave Anisotropy Probe (WMAP) indicates that the Cosmological Constant may not have been Einstein's greatest mistake after all!
©2013, Kenneth R. Koehler. All Rights Reserved. This document may be freely reproduced provided that this copyright notice is included.
Please send comments or suggestions to the author.