size = distance * angular diameterradianswhere a radian is 180/π degrees. Here are some examples of variation of angular diameter with distance:
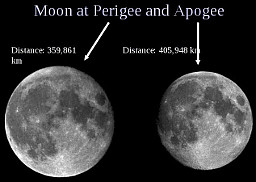 | The Moon at perigee and apogee. | source |
 | The Sun at perihelion and aphelion. | source |
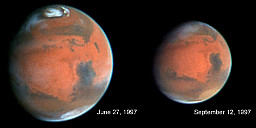 | The changing face of Mars. | source |
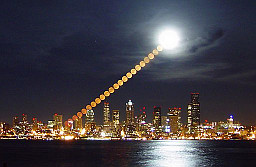 | The angular size remains constant, no matter what your brain tells you. | source |
Perigee is the point of closest approach during the orbit of a satellite about the Earth. Similarly, perihelion is the point of closest approach during orbit of the Sun. Apogee is the point of greatest distance from the Earth during orbit, and aphelion is the point of greatest distance from the Sun during orbit.By setting the angular diameter in the equation above to the resolution of a telescope, we can compute the size of the smallest object it can see at any given distance. The resolution is determined by interference effects and depends on the size of the optics (usually a mirror) and the wavelength being observed:
angular resolutionarcsec = .0025 * wavelengthAngstroms / mirror diametercmFor instance, the Hubble Space Telescope (below) has a mirror diameter of 2.4 meters, or 240 cm. At optical wavelengths (for instance, 5600 Angstroms), its angular resolution would be
.0025 * 5600 / 240 = .0583 arc seconds,Looking at Saturn at closest approach (8.004 AU, or 1.197 * 1012 m), the Hubble could resolve an object whosetimes π / (180 * 3600) radians in an arc second = 2.828 * 10-7 radians.
size = 1.197 * 1012 * 2.828 * 10-7 = 338.6 km wide.The light gathering power (literally, how much electromagnetic radiation the instrument can gather in a given amount of time) is proportional to the square of the mirror radius. This is important because intensity decreases with the square of the distance: if you move twice as far away, the intensity drops to one quarter of what it was at the original position. This is why we distinguish between apparent magnitude and absolute magnitude (M):
M = apparent magnitude + 5 - 5 * log10 distancepc.Absolute magnitude is the magnitude a star would have at a fixed distance of 10 parsecs; the apparent magnitude (m) will be larger than M if the star is more than 10 parsecs distant, and less than M if it is closer. You can barely see a star of apparent magnitude 6 with your eyes, if you are in a region of dark skies. Under the same conditions, binoculars takes you to magnitude 10 and 8 inch telescopes to about magnitude 13. The Hubble telescope can just see objects of apparent magnitude 30.
There are severe limits to which types of electromagnetic radiation can be observed from the Earth's surface. The Earth's atmosphere is transparent to radio waves with wavelengths between about 10 meters and 1 cm, and to infrared and visible wavelengths from 105 Angstroms to the near ultraviolet (around 2900 Angstroms).
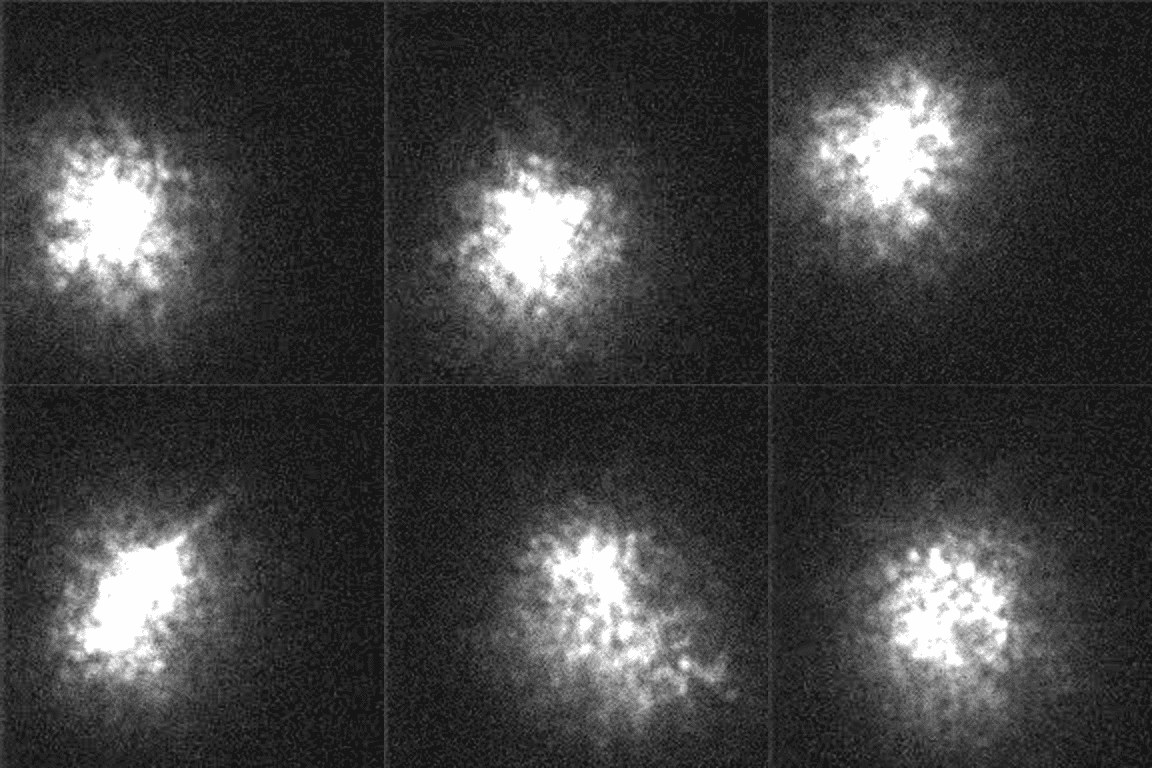
Much of what we observe requires extremely long exposure times.

The Ritchey-Chretien design is a variation on the basic reflector telescope, and differs from the Cassegrain reflector in that the main mirror is shaped like a hyperbola instead of like a parabola, improving the image quality.
In any astronomical image, it is important to distinguish stars located in our galaxy as opposed to more distant objects. Such stars are always accompanied by diffraction spikes, which are caused by diffraction of starlight by the secondary mirror supports. In this image, there is one very close star at lower right, and a number of others around the periphery; everything else is a galaxy or a (curved) gravitational lens image:Some of the premier telescopes in recent use are:
Galaxy cluster Abell 370. (source)
It has two instruments: NUV, observing in the range 1750-2800 A, and FUV, observing in the range 1350-1750 A; both have 2 Mpixel detectors.
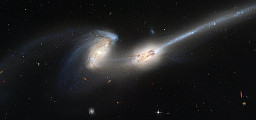 | NGC 4676, taken by the Hubble Advanced Camera for Surveys. | source |
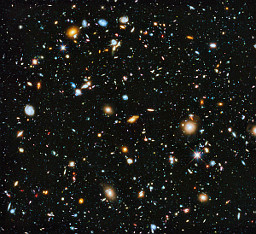 | "Empty" space, taken by the Hubble Wide Field and Planetary Camera. | source |
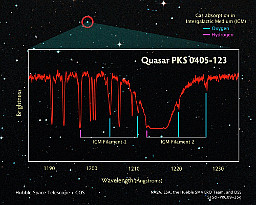 | A measurement of the spectrum of Quasar PKS 0405-123, made by the Hubble Cosmic Origins Spectrograph. | source |
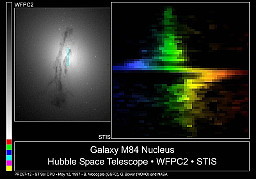 | Spectrograph of M 84, made by the Hubble Space Telescope Imaging Spectrograph. | source |
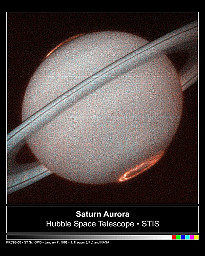 | UV auroras on Saturn, taken by the Hubble Space Telescope Imaging Spectrograph. | source |
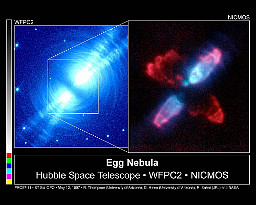 | The Egg nebula, taken by the Hubble Near Infrared Camera and Multi-Object Spectrometer. | source |
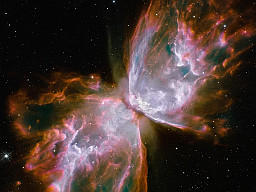 | NGC 6302, taken by the Hubble Near Infrared Camera and Multi-Object Spectrometer. | source |
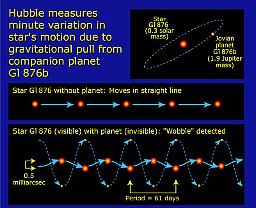 | A measurement of the wobble of Gliese 876 made by the Hubble Fine Guidance Sensors. | source |
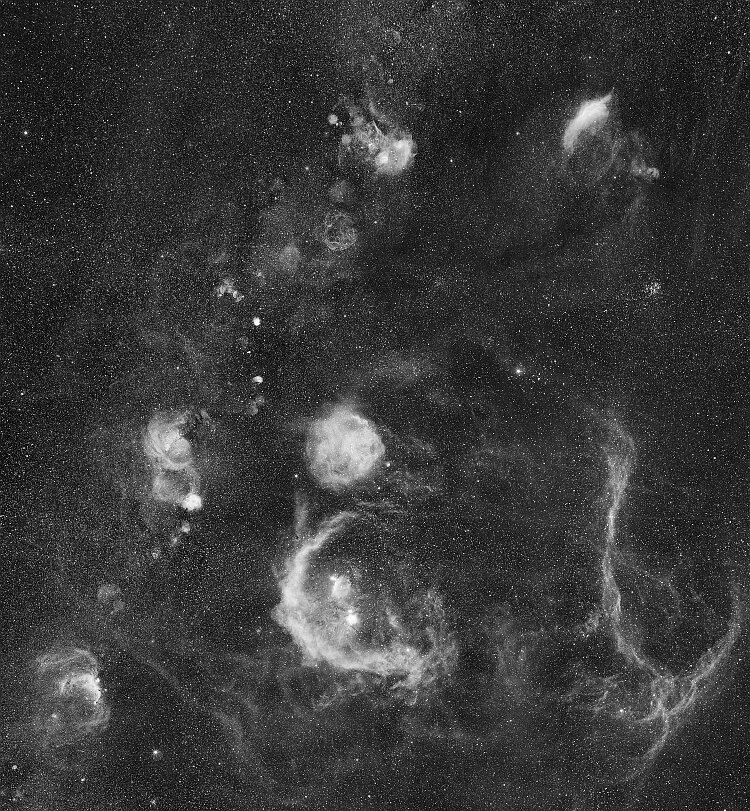
 | Mira, as imaged by Galex. | source |
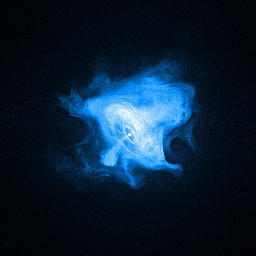 | The Crab nebula, taken by the Chandra Advanced CCD Imaging Spectrometer. | source |
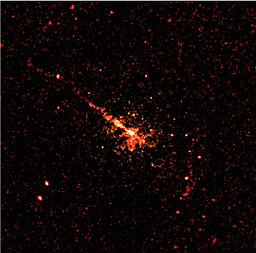 | Centaurus A, taken by the Chandra High Resolution Camera. | source |
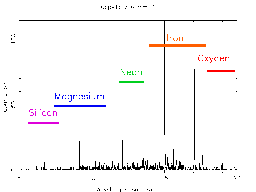 | A measurement of the spectrum of Capella, made using the Chandra High Energy Transmission Grating. | source |
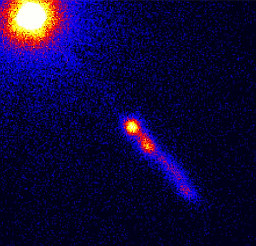 | Quasar 3C273, taken by the Chandra Low Energy Transmission Grating. | source |
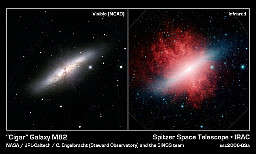 | M 82, taken by the Spitzer Infrared Array Camera. | source |
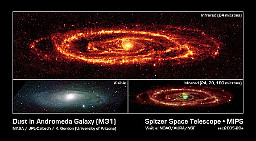 | M 31, taken by the Spitzer Multiband Imaging Photometer. | source |
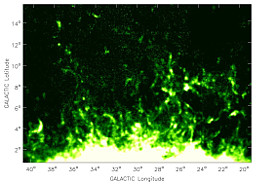 | The Milky Way halo, imaged by Green Bank. | source |
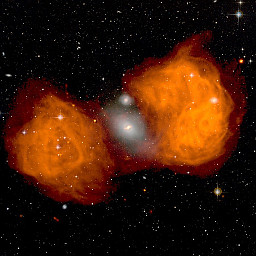 | Fornax A, imaged by the VLA (radio image in orange). | source |
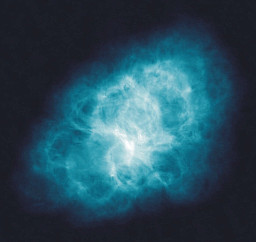 | The Crab Nebula, imaged by the VLA. | source |
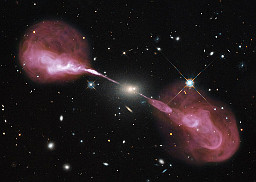 | Elliptical galaxy Hercules A, imaged by Hubble WFC3, the jets by VLA. | source |
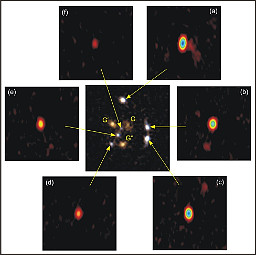 | Images of a gravitational lens, taken by the VLBA. | source |
(View Cosmos DVD 6, episode 10, dramatization of red shift discoveries at Mt. Wilson.)
Portfolio Exercise: Research 3 additional telescopes, each in a different region of the electromagnetic spectrum.Note that many telescopes, both ground-based and space-based, have multiple instruments. Be specific about which instruments you are discussing.For each, identify the range(s) of wavelengths it is sensitive to, and its resolution at those wavelengths. Use published resolutions if you can find them; otherwise, compute the resolution from the equation above. What is the smallest object it could discern at 1 parsec? 1000 parsecs? 1 million parsecs? For 1 and 1000 parsecs, compute your answers in both parsecs and A.U.For each telescope, include an image in representative colors taken by the telescope, and explain what observational wavelengths correspond to each primary color.
Include references for wavelength and resolution information, and for the images.
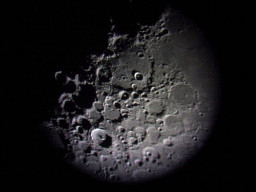 | Along the Moon's terminator, using a Meade 8 inch LX-90 with a 12.4 mm eyepiece. | |
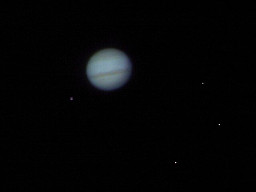 | Jupiter and the Galilean Moons, using a Meade 8 inch LX-90 with a 12.4 mm eyepiece. |
These images were taken in suburban Cincinnati on a clear night, through the eyepiece with a Cannon G-1 and an Orion SteadyPix camera mount. When taking photographs through the lens, alignment is a major headache. However, these photos give a pretty good idea of what you see with your eye. While detail is lacking and the colors are somewhat washed out, there is certainly something very exciting about seeing light from the planets with your own eyes, and no one fails to express awe when they look at Saturn. But what about deep sky objects?
Looking through this telescope, M-31 (Andromeda) is a faint smear of dust. M-42 (the Orion Nebula) has a clear shape but no color, and the LCD screen on the camera is not sensitive enough to focus properly at any rate. So why can't you see what the Hubble sees? Even though you are on the ground, you'd think you could do better than that!
The whole problem is one of intensity. Your eye can't add up the light received over a long period, as a digital camera might. When the intensity is so low, your color-sensitive cone cells are inactive, and so you only see in black and white. The beautiful deep-sky photos shown by the Hubble were long exposures, with the light accumulated over minutes or hours; for instance, the photo of M-104 took 10.2 hours. The deep-field photo above took over 48 hours.
And so amateur astronomers who want pictures like those taken by the professionals use CCD cameras specifically designed to fit the telescope in place of the eyepiece. They take black and white photos of the same object three times, through red, green and blue filters, and then composite them into a color image. And they take many photographs a second, using computer software to scan through the tens or hundreds of thousands of images, discarding those blurred by momentary atmospheric turbulence, and then "stack" the images (literally adding the intensities) to produce the final product. A stroll through the Astronomy Picture of the Day Archive will show many examples of amateur photographs which rival some of those taken professionally.
When cosmic rays hit the atmosphere they produce a shower of particles. It is this shower which is detected by cosmic ray observatories such as the Pierre Auger Cosmic Ray Observatory in western Argentina. Their goal is not to produce an image of a cosmic ray source, but to simply identify the sources and measure the energies associated with cosmic rays. To do this, the Auger Observatory has constructed 1600 detectors covering an area of about 3000 km2. Events with energies over 1019 eV have a flux of about 1 per km2 per year.
The Kamioka Observatory in Japan has been instrumental
in confirming our understanding about supernova explosions, and in determining that neutrinos indeed have mass. Its instrument,
Super-Kamiokande, is comprised of 13027 photomultiplier tubes in 50000 tons of pure water. The tubes detect Cherenkov Radiation:
electromagnetic energy emitted by charged particles whose speed is greater than the speed of light in water (about
2.25 * 108 m/s). When a neutrino interacts with an atom in the water, an electron or muon is created whose
track the tubes can measure. The instrument typically detects less than 14 solar neutrino events per day.
The latest high-energy neutrino observatory is currently under construction using 1 km3 of Antarctic ice:
the IceCube Neutrino Observatory. It will focus on neutrinos entering the opposite side of
the Earth so that the lower-energy neutrinos associated with cosmic ray showers will not be confused with those of extraterrestrial
origin.
But no one had ever directly detected a gravitational wave. It is the purpose of
LIGO - the Laser Interferometer Gravitational-wave Observatory - to change that.
LIGO consists of two L-shaped detectors, each 4 km long, one in Hanford, Washington, and the other in Livingston, Louisiana.
In each, laser light travels repeatedly from one end to the other, reflected by mirrors. A passing gravitational wave will change the
relative lengths of the two beams, and the change in the interference pattern will be registered by a photodetector.
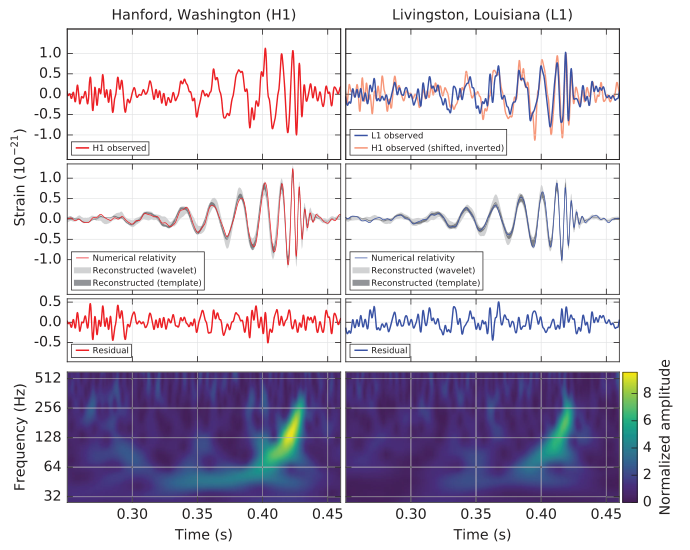
On September 14, 2015, LIGO observed for the first time gravitational radiation from the
inspiral and merger of two black holes:
The top panels show the actual signals (strain is a fractional change in length),
the middle panels show the fit to the predictions of General Relativity (and the residual noise),
and the bottom panels show the frequency, all as a function of time. The sharp rise in
frequency ("chirp") occurs just before the merged black hole "rings down" to a stationary state.
The masses of the black holes were inferred to be 36 and 29 solar masses, resulting in a
merged 62 solar mass black hole; the resultant gravitational waves radiated away approximately
3 solar masses. The final black hole is spinning at approximately two thirds the maximum possible
rate. The event took place several hundred megaparsecs away.
©2017, Kenneth R. Koehler. All Rights Reserved. This document may be freely reproduced provided that this copyright notice is included.
Please send comments or suggestions to the author.
Neutrino Astronomy
The purpose of neutrino astronomy is much the same as that of cosmic ray astronomy: to detect sources and measure energies.
Neutrinos are electrically neutral, almost massless, and interact so weakly that the flux of solar neutrinos
through the Earth of approximately 65 billion per cm3 passes through the Earth each second with only a handful of interactions. These facts
makes this perhaps the most difficult astronomical undertaking besides the detection of gravitational waves.
Gravitational Wave Astronomy
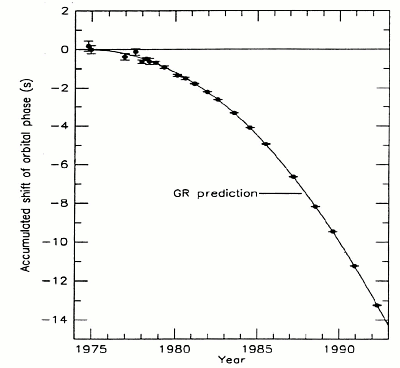
In 1974, Taylor and Hulse found a binary system of neutron stars, one of which is a pulsar.
After two decades of observation, they
determined that the change in the rate of spin of the pulsar matched the predictions of General Relativity for such a system
emitting gravitational waves:
The changing orbit of binary pulsar PSR 1913 + 16 meets General Relativity. (source)
 Gravitational wave event GW150914. (source)
