
are all forms of electromagnetic radiation. They are all waves: periodic functions of space and time. The length of a spatial period is called the wavelength and is denoted λ. The inverse of the temporal period is called the frequency (denoted ν) and is measured in cycles per second, or Hertz (Hz). All of these waves propagate at the speed of light (c), and for our purposes, obey the simple dispersion relation
c = wavelength * frequencyThis applet might help you to better visualize waves. You can choose sine waves or cosine waves; the number on the left is just 2π, and shows you the scale of the plot. If you think of the horizontal axis as distance, then you are seeing wavelengths. If you think of it as time, you are seeing periods. The wave number is the number of waves that fit in a given length or time, and the phase angle determines what happens at the origin. As you can see, higher wave numbers give you smaller wavelengths and higher frequencies:
All of these types of electromagnetic radiation consist of changing electric and magnetic fields, and differ only by their wavelength (or frequency):
| radiation | λ | ν (Hz) | energy (eV) | source |
|---|---|---|---|---|
| radio | > 1 m | < 3 * 108 | < 1.24 * 10-6 | low-energy atomic or molecular motions |
| microwave | > .1 mm | < 3 * 1012 | < .0124 | rigid molecular motions |
| infrared | > 7000 Angstroms | < 4.3 * 1014 | < 1.78 | molecular bond motions |
| visible light | > 4000 Angstroms | < 7.5 * 1014 | < 3.1 | atomic electron transitions |
| ultraviolet | > 50 Angstroms | < 6 * 1016 | < 248 | atomic electron transitions |
| x-rays | > .03 Angstroms | < 1020 | < 414 K | electron transitions in heavy atoms |
| gamma rays | < .03 Angstroms | > 1020 | > 414 K | nuclear decays |
An Angstrom (A) is 10-10 meters. An electron-volt (eV) is 1.602 * 10-19 Joules (a 60 Watt light bulb uses 60 Joules of energy every second).
The energy column corresponds to the energy of a single photon: the smallest amount of radiation possible. The energy (in eV) of a photon of frequency ν is
energyeV = h * frequency / e,where h is Planck's Constant (6.626 * 10-34 Js) and e is the number of Joules in an eV.
The terms "near" and "far", when applied to ultraviolet and infrared wavelengths, indicate how close they are to the visible wavelengths.


 | M 31 (the galaxy in Andromeda) in optical light. | source |
 | M 31 in infrared, R = 80,000 A, B = 36,000 A with star light subtracted. | source |
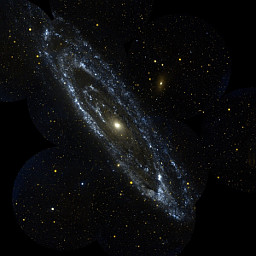 | M 31 in ultraviolet, R = 1750-2800 A, B = 1350-1750 A. | source |
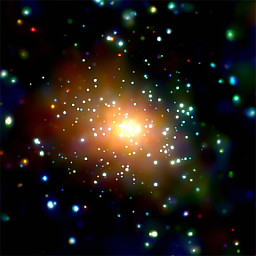 | M 31 in x-ray, R = 12.4-24.8 A, G = 6.2-12.4 A, B = 3.1-6.2 A. | source |
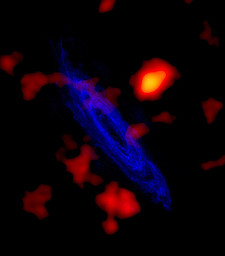 | M 31 in radio, 21 cm (2,100,000,000 A). | source |
 | M 104 in optical. | source |
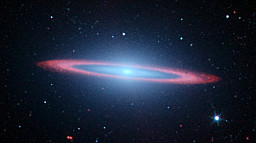 | M 104 in infrared, R = 80,000 A, Orange = 58,000 A, G = 45,000 A, B = 36,000 A. | source |
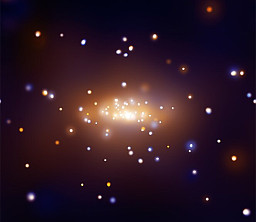 | M 104 in xray, Orange = 8.3-41.4 A, B = 1.8-8.3 A. | source |
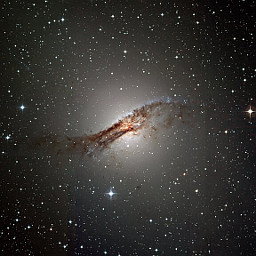 | NGC 5128 (Centaurus A) in optical. | source |
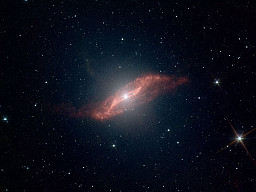 | NGC 5128 (Centaurus A) in infrared, 36,000-80,000 A. | source |
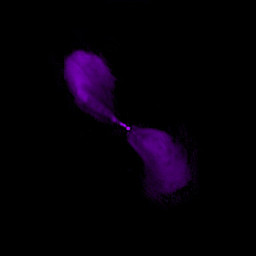 | NGC 5128 (Centaurus A) in radio, 20 cm. | source |
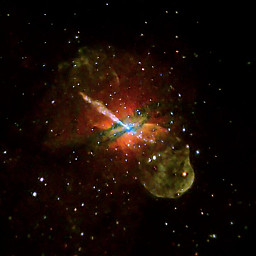 | NGC 5128 (Centaurus A) in x-ray, R = 12.4-24.8 A, G = 9.3-12.4 A, B = 6.2-9.3 A. | source |
 | A jet from a young star in the Carina Nebula, R = 6730 A, G = 6560 A, B = 5020 A. | source |
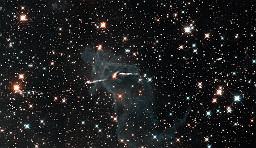 | A jet from a young star in the Carina Nebula in infrared, Orange = 16,400 A, Cyan = 12,600 A. | source |
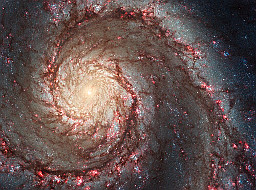 | M 51 in visible light. | source |
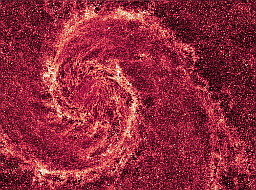 | M 51 in infrared, with most of the visible light removed, showing the distribution of dust. | source |
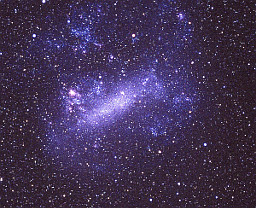 | The Large Magellanic Cloud in visible light (ESO). | source |
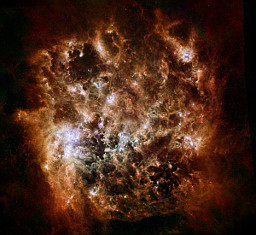 | The Large Magellanic Cloud in infrared, Red = 2,500,000 A, Green = 1,000,000 and 1,600,000 A (Herschel), Blue - 240,000 and 700,000 A (Spitzer). | source |
We see that higher frequency or energy, and smaller wavelengths, correlate with higher temperature. This is natural, because temperature is simply a measure of thermal energy.
Almost all that we know about the universe comes from these five attributes of electromagnetic radiation:
Pressure waves in the Sun, caused by violent events on the surface, can travel through the Solar interior. As they do so, they undergo refraction: their direction of propagation changes because the speed of sound changes with depth (the speed of sound depends on density and temperature, which increases with pressure). Astronomers have exploited these changes of direction to explore the details of the Solar interior; this is known as Helioseismology.
The total power output over all wavelengths is called the luminosity, and is related to the intensity byintensity = luminosity / (4 π distance2)This is often called the inverse square law, and is a result of the fact that in three spatial dimensions ("3D"), the area of a sphere is 4 π r2: the electromagnetic radiation propagates symmetrically in all directions, so surfaces of equal intensity are spheres:
The inverse square law.
So the luminosity is determined by the source, but the intensity also depends on where you are when you are looking at it.
In general, electromagnetic waves are radiated such that their electric field directions are randomly distributed. If, however, they pass through a medium whose molecules have been oriented along a magnetic field, the medium can polarize the waves so that their electric fields are aligned along a single direction (this is the same principle used in polarized sunglasses, except there it is not a magnetic field but a crystalline structure that is responsible for the polarization). Astronomers have very cleverly used the amount of polarization to measure the magnetic fields of the interstellar medium. Most such measurements are in radio wavelengths, and typically give magnetic field strengths on the order of 10-5 to 10-4 that of the Earth, although fields near the galactic center have been measured to be of order 10 times stronger.
While electromagnetic wave direction, intensity, wavelength, phase and polarization account for the vast majority of our knowledge of the universe, there are three notable exceptions: cosmic rays, neutrinos and gravitational waves.
We often measure the spectrum of an object: the distribution of the intensity (energy per unit area per unit time) of the electromagnetic radiation we observe as a function of wavelength. We will return to this subject soon.
This reinforcement and cancellation varies with time and position to produce an interference pattern. This is the interference pattern produced by two sources (which are located at the bottom of the plot):
Alternatively, if we place two or more telescopes at different locations and look at the same object, we can use the information about how their images interfere to construct a more detailed picture of the object. The positions of the telescopes must be determined very precisely, so this technique is primarily practical for ground-based astronomy. Since the atmosphere is opaque to far ultraviolet and many infrared wavelengths (due to absorption by water, Oxygen and Carbon Dioxide), interferometry is limited to optical, radio and a few near-infrared ranges.
©2013, Kenneth R. Koehler. All Rights Reserved. This document may be freely reproduced provided that this copyright notice is included.
Please send comments or suggestions to the author.