
d = v / H0We should view this as a correction to the absolute magnitude, but for the sake of simplicity we will continue to use the value of M from the table.= 572 km / s / (69.9 km/s / Mpc)= 8.18 Mpc
We can compute the maximum speed of UGC 2034's rotation from the relation
line width = 2 * speed * central wavelength / cby solving for the rotational speed (and including the Doppler Shift!) as
v = ((c / 2) * width / λcentral) / (1 + vrecession / c)The absolute magnitude can be used (as above) to determine the luminosity as= ((c / 2) * 2.43286 / 6562.78) / (1 + 572000 / c)= 55500 m / s
L = 10(4.83 - (-17)) / 2.5From our statistical discussion in the portfolio exercise, the average mass to luminosity ratio in solar units is around 1/2. Hence the mass of UGC 2034 should be in the neighborhood of 2.7 * 108 Msolar. But we can use Newton's Laws to check this. First, the radius of UGC 2034 can be computed from the angular diameter (converting from arc minutes to radians) as= 5.4 * 108 Lsolar
r = d * diameterangular * π / (60 * 180) / 2Then we can solve the relation for orbital velocity= 8.18 Mpc * 2.818 * π / (60 * 180) / 2= 3353 pc
orbital velocity = (G * mass / radius)1/2for mass, obtaining
m = v2 * r / GThis is almost 9 times our estimate from the luminosity. We have probably over-estimated the mass because our rotational velocity represents the maximum possible consistent with the observations. But even if our velocity is twice the actual (which is unlikely), there is still more than twice as much mass in UGC 2034 as we can see.= 555002 * (3353 * 3.086 * 1016) / G= 4.776 * 1039 kg
= 2.4 * 109 Msolar
While there is significant variation in the mass to luminosity ratio depending on both size and morphology, the general conclusions are the same: assuming that Newton's Laws hold throughout the universe, it is clear that galaxies have more matter than is visible to our telescopes!
This issue raises an important question about the Tully-Fisher Relation between rotational velocities and luminosity: how is the dark matter, which contributes to the rotational velocities but not to the luminosity, linked to the luminous matter?
Since dark matter and (normal) baryonic matter are mutually attracted by gravity, one might expect that the two should be highly correlated in space. Suppose that as a galaxy forms, this is true in the beginning. As the galaxy takes shape, the baryonic matter can cool, but since the dark matter cannot interact electromagnetically, it cannot. The baryonic matter can condense to form stars, etc., but the dark matter retains its initial essentially spherical distribution.
Portfolio Exercise: Create a table with the Hubble Distance, Doppler rotational speed, luminosity, luminous mass, angular diameter and total mass (from the orbital velocty relation) for all 20 galaxies in this sample.
This applet lets you "design" a galaxy and view the corresponding rotation curve (velocity as a function of distance from the center). It assumes that within the galactic disc, the mass is evenly distributed by volume. The same assumptions are made for the central bulge and the dark matter halo, which is drawn in violet. The disc thickness is assumed to be 1% of its radius, and the bulge radius is limited to 50% of the disc radius. The width of the graph is twice the largest chosen radius, and the color intensity is scaled so that the largest mass selected corresponds to the brightest colors.
Begin with a dark matter radius of about 3 times the disc radius. Then vary the dark matter mass and radius
until the rotational velocity curve (across the top) looks approximately like the
ones in the graph above (or like the curve shown when the applet starts, which is approximately what is expected for the Milky Way).
In most cases you will have to lower the dark mass from your calculated value to reproduce the expected velocity curve.
Include images of your final profiles in your portfolio.
In the Bullet Cluster, gas is glowing red (in x-rays), showing the shock waves from the
colliding clusters, while their dark matter (in blue) is passing through each other relatively unimpeded.
©2017, Kenneth R. Koehler. All Rights Reserved. This document may be freely reproduced provided that this copyright notice is included.
Please send comments or suggestions to the author.
Portfolio Exercise:
In the sample galaxies we have been working with, the paper lists all as spirals except 2034, 5829, 5935 and 12060. For three of those spiral galaxies,
use the applet above to create dark matter profiles. Start with the values you have calculated for the luminous mass, disc radius
and dark matter mass. Use SIMBAD and the Aladin viewer to obtain an image
of each galaxy, and estimate the bulge radius and the percentage of luminous matter in the bulge using the image. If a blue ("O" filter)
JPEG is available, it is often the clearest image. If you cannot decide from the image, you may assume
that the bulge radius is 20 to 30 % of the disc radius, and that the percentage of luminous mass in the bulge is about 30.
Cluster Dark Matter
Since galactic rotation curves first indicated the presence of dark matter, gravitational lensing
has enabled astronomers to image dark matter:
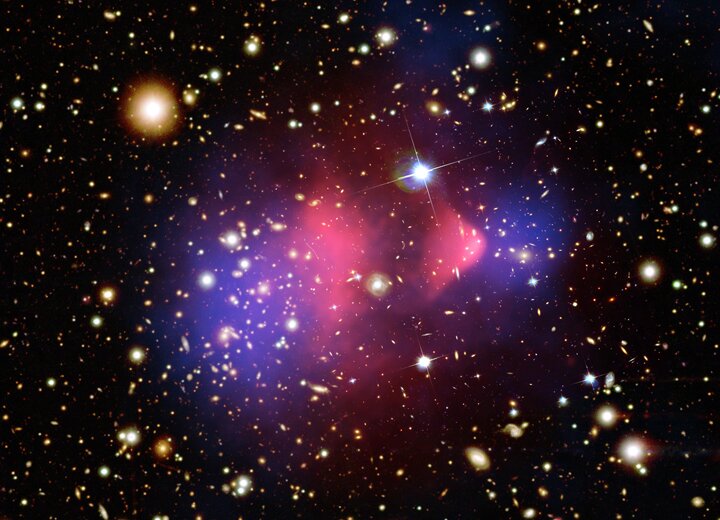
Dark matter (blue) and x-ray gasses (red) in the Bullet cluster. source 
Distributions of visible and dark matter. source 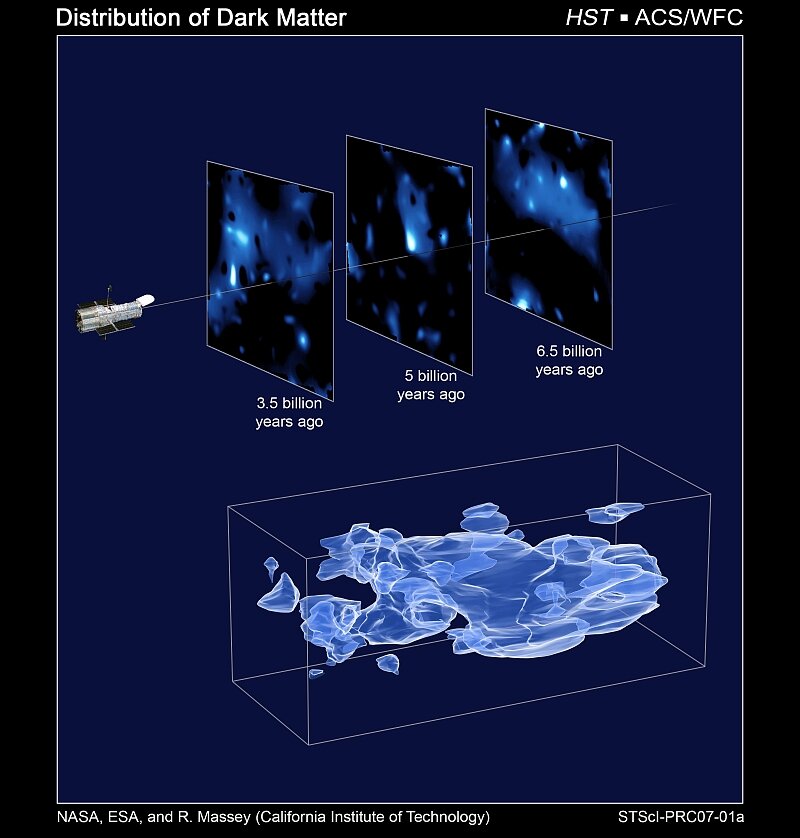
The evolution of dark matter over some of the "recent" history of the universe. source 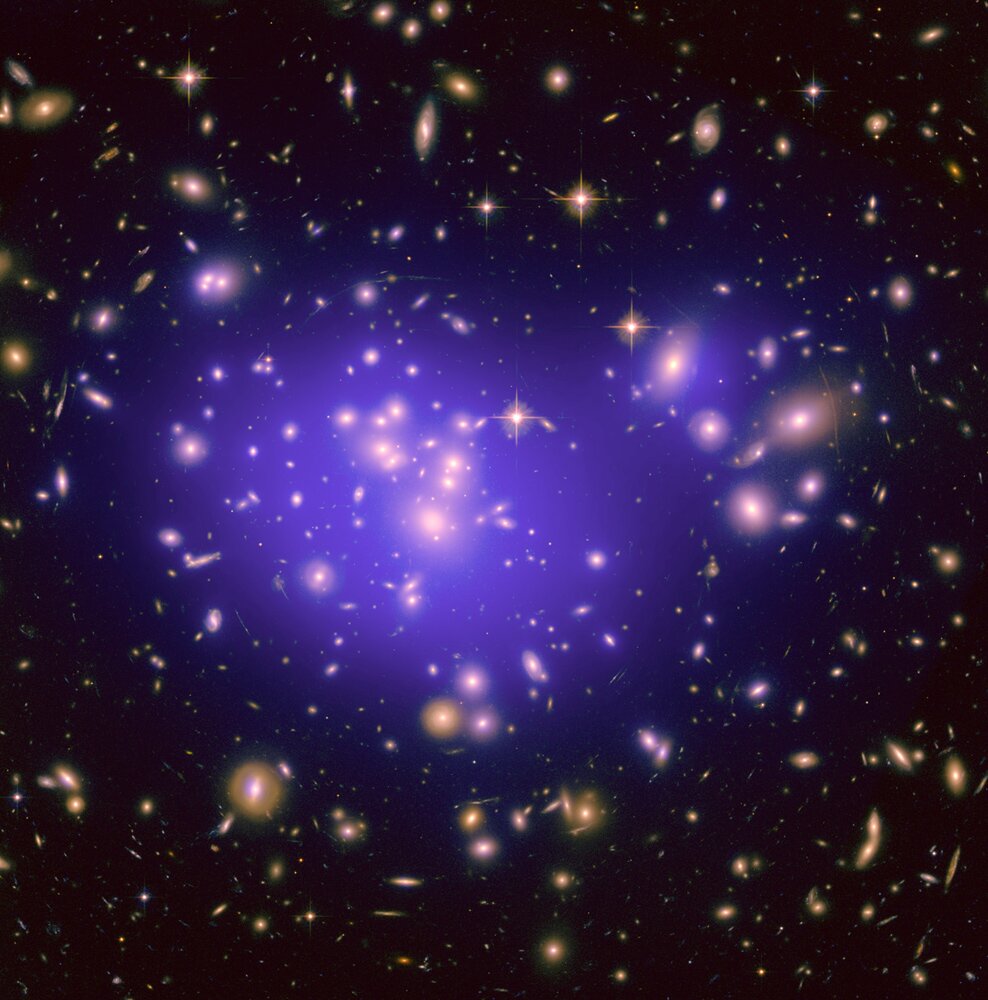
Gravitational lensing by dark matter (blue) associated with cluster Abell 1689. source